Join our fan page
- Views:
- 27719
- Rating:
- Published:
- Updated:
-
Need a robot or indicator based on this code? Order it on Freelance Go to Freelance
Method of charts analysis developed by Nicolas Darvas is very popular in Europe and USA. Though this peculiar and simple method is still not very popular in Russia.
Let's try to shed some light on it.
Darvas trading technique is based on his method of a new trend detection. Buy signals are generated at the moment the bullish trend is confirmed and stop levels are set at the same time. Darvas used his method for trading on day charts. Therefore, his method almost ideally suits the traders with full-time jobs.
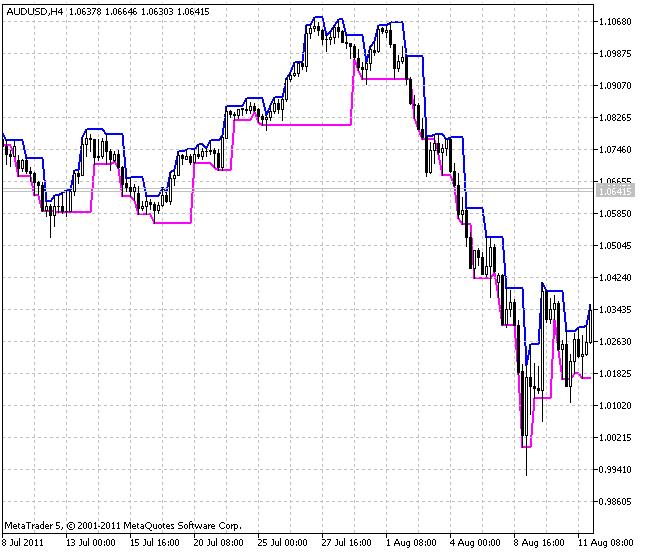
Darvas used a special filter for his work - Darvas Box. It helped Darvas to determine the importance of various market movements. The filter consists of the upper and lower borders of the area.
The brief method description is as follows: we should buy in case of the upper border breakout. At this very moment a stop level under the lower border is installed. In case a new area is formed, the stop levels are moved under the lower border of the new area. The reverse situation is for selling.
The area is formed the following way.
Steps 1-2. Generation and saving of the upper border.
The first day the highest price of the day is specified as the upper border of the Area. Further on, the verification is performed each following day if the upper border of the area is lower than the highest price of the day. If that is not the case, the upper border of the Area is shifted to the new maximum point level.
In case on the third day the upper border is higher than the day maximum, the upper border is supposed to be formed (step 2) and it is the time to pass to steps 3-4. In case the day maximum exceeds or is equal to the upper border price, the upper border is shifted to the new level and a new verification is performed the next day. Verification is performed until the upper border is not higher than the day maximum.
Steps 3-4. Generation and saving of the Area lower border.
At the day when the upper border is finally formed, the initial value for the lower border is set as the minimum price for the previous days.
Then
the generation of the lower border is performed similarly to the upper one: the lower border is supposed to be formed when the day maximum is higher than the lower border of the area.
In case the day maximum breaks out the upper border at that stage, the upper border is set to be equal to that value and the algorithm passes to step 1.
After the lower border of the Area is formed the whole Area is supposed to be finished and it is time to pass to step 5.
Step 5. Waiting for a buy/sell signal The breakout of the Area upper or lower borders by the price is traced at this stage. In case the upper border is passed, the asset is bought and a stop level is set under the lower border
Image:

Translated from Russian by MetaQuotes Ltd.
Original code: https://www.mql5.com/ru/code/498
 MFCS Currency Correlation Chart
An indicator to put correlated currency charts on a given currency chart. It shows only bars currently. Color/monochrome mode is configurable. It also supports currency inversion for handling EURUSD & USDCHF like pairs.
 BykovTrend
Simple indication of a newly born trend using colored arrows on a chart.
 Fine Fractals
Fine Fractals can show important price curves, highs and lows in the cases where the standard Fractals indicator fails.
 SymmetricDarvasBoxes
Symmetric Darvas Boxes for Forex.