Join our fan page
- Views:
- 6008
- Rating:
- Published:
- Updated:
-
Need a robot or indicator based on this code? Order it on Freelance Go to Freelance
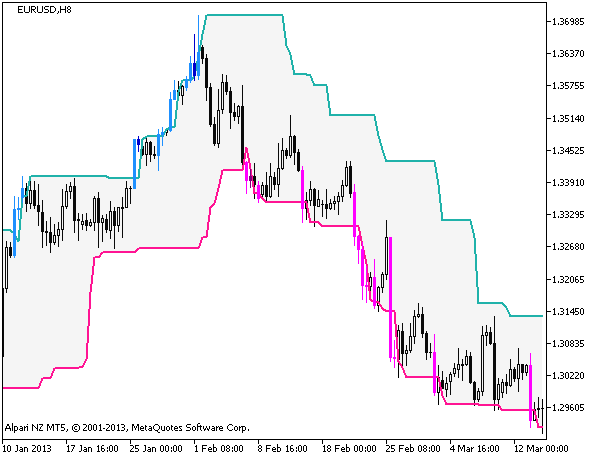
The indicator implements a breakthrough system using a channel drawn on extrema for a period.
When price exits the gray channel, the candlestick color changes to the color corresponding to trend direction. Blue for the growth of a financial asset, pink color - fall. Bright colors denote coincidence of trend direction and direction of a candlestick. Dark colors correspond to the situation when the direction of a candlestick is opposite to trend.

Figure 1. The PChannel_System indicator
Translated from Russian by MetaQuotes Ltd.
Original code: https://www.mql5.com/ru/code/2328
 Linear_Price_Bar
A candlestick chart, all the Open prices of which are shifted to zero.
 Tally for Wins and Losses
Way to keep a tally of wins an losses.
 DynamicRS_C
A trend indicator of the series of indicators without averaging.
 MultiHighsLowsSignal
The MultiHighsLowsSignal indicator shows information on active trends using the values of seven HighsLowsSignal indicators from different timeframes.