Join our fan page
- Views:
- 9039
- Rating:
- Published:
- Updated:
-
Need a robot or indicator based on this code? Order it on Freelance Go to Freelance
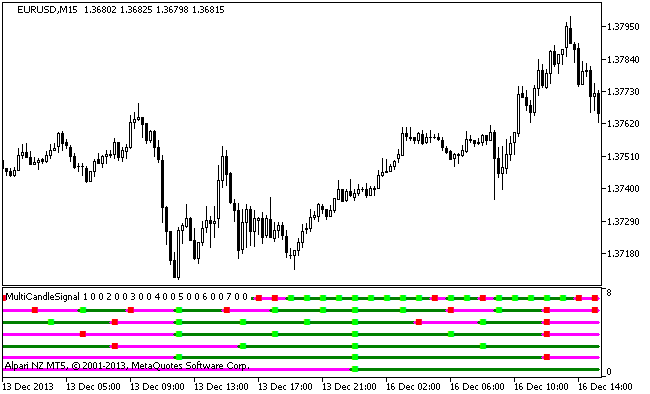
The MultiCandleSignal indicator displays information on current trends using candlestick direction from seven different timeframes.
One of the seven indicator lines corresponds to each timeframe. If the candlestick is growing on the corresponding timeframe, the line color is green. If its is falling, the line is pink. Color squares on lines occur when the bar of the corresponding timeframe changes.

Figure 1. The MultiCandleSignal indicator
Translated from Russian by MetaQuotes Ltd.
Original code: https://www.mql5.com/ru/code/2130
 T3_TRIX
The TRIX indicator uses Tilson averaging.
 BackgroundСandle_BrainTrend2_HTF
The indicator draws rectangle candlesticks of a higher timeframe based on the values of the BrainTrend2 indicator.
 T3_TRIX_HTF
The T3_TRIX indicator with the timeframe selection option available in input parameters.
 RSIOMA_V2
The trend indicator using an oscillator algorithm drawn in the form of a colored cloud with additional indication.