Join our fan page
- Views:
- 10557
- Rating:
- Published:
- Updated:
-
Need a robot or indicator based on this code? Order it on Freelance Go to Freelance
The indicator uses analysis of values of Heiken Ashi Open and Heiken Ashi Close.
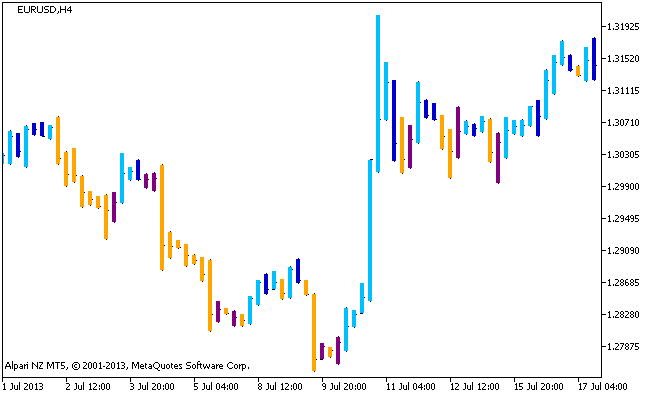
Candlestick opening and closing values are calculated by Heiken Ashi algorithm, their directions are determined and only these directions of Heiken Ashi candlesticks are drawn on a price chart as colored bars.
If the direction of trend of the Heicken Ashi candlesticks and of chart candlesticks match, the color of the bar is light, if opposite, the bar is dark.

Figure 1. The Heiken_Ashi_BARS indicator
Translated from Russian by MetaQuotes Ltd.
Original code: https://www.mql5.com/ru/code/2120
 TTM-Trend
The indicator uses analysis of values of Heiken Ashi Open and Heiken Ashi Close for a selected period.
 GannSwingsVIII
A semaphore indicator with a ZigZag.
 RSI_BARS
The indicator changes the bar color to the color of the current trend calculated based on the RSI technical indicator.
 Background_Heiken_Ashi_Сandle_HTF
The indicator draws Heiken Ashi candlesticks of a higher timeframe as color filled rectangles using DRAW_FILLING buffers.