Join our fan page
- Published by:
- [Deleted]
- Views:
- 10902
- Rating:
- Published:
-
 You are missing trading opportunities:
- Free trading apps
- Over 8,000 signals for copying
- Economic news for exploring financial markets
Registration Log inYou agree to website policy and terms of use
If you do not have an account, please register -
 Need a robot or indicator based on this code? Order it on Freelance
Go to Freelance
Need a robot or indicator based on this code? Order it on Freelance
Go to Freelance
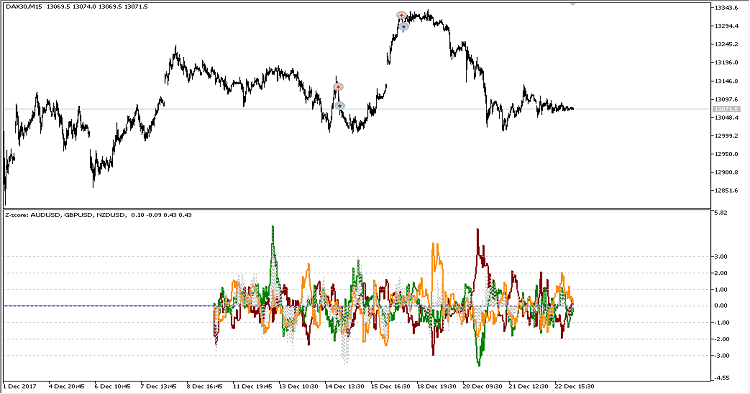
The indicator finds linear regression coefficients between each of the selected symbols and all other symbols, and displays them in the form of standard deviations. The sum of all the curves is displayed as a gray dashed histogram, which shows the deviation of the model portfolio from its real value. It can be used for experimenting with manual or automated pair trading.
Input Parameters
- learning_depth - the calculation period in bars;
- SymbolsList - required symbols separated by commas.
Translated from Russian by MetaQuotes Ltd.
Original code: https://www.mql5.com/ru/code/19630
 RMI_Histogram
Relative Momentum Index implemented as a color histogram with an indication of overbought and oversold zones.
 Exp_XFatlXSatlCloud_Duplex
Two identical trading systems based on the change in the color of XFatlXSatlCloud for long and short trades, which can be configured in different ways in one Expert Advisor.
ColorSRoC
The smoothed S-RoC indicator of the relative price increment by Fred Shutsman.
JS_SISTEM_2
The Expert Advisor uses three iMAs (Moving Average, MA), one iOsMA (Moving Average of Oscillator and one iRVI (Relative Vigor Index, RVI). Trailing stop is based on the High/Low of earlier bars.