Join our fan page
- Views:
- 4155
- Rating:
- Published:
-
Need a robot or indicator based on this code? Order it on Freelance Go to Freelance
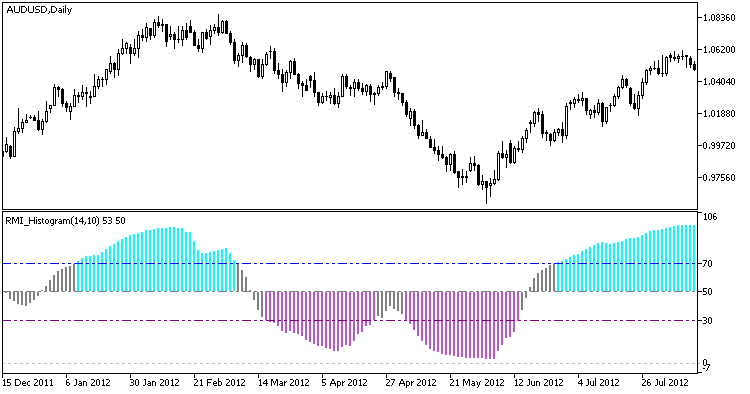
Relative Momentum Index implemented as a color histogram with an indication of overbought and oversold zones.
RMI (Relative Momentum Index) was developed by Roger Altman and was first published in 1993 in the 'Technical Analysis of Stocks&Commodities' magazine. RMI is a stochastic, which can be used for improving the quality of Relative Strength Index (RSI). It generates signals when the price reaches the overbought or oversold zone.

Fig.1. The RMI_Histogram indicator
Translated from Russian by MetaQuotes Ltd.
Original code: https://www.mql5.com/ru/code/19629
 Exp_XFatlXSatlCloud_Duplex
Two identical trading systems based on the change in the color of XFatlXSatlCloud for long and short trades, which can be configured in different ways in one Expert Advisor.
 XRSXTrend_NRTR
A semaphore signal indicator using the XRSX oscillator, which is similar to BykovTrend with an NRTR line based on the values of the ATR indicator.
 Cointegration
The indicator calculates and displays a linear relationship between two or more financial symbols.
 ColorSRoC
The smoothed S-RoC indicator of the relative price increment by Fred Shutsman.