Join our fan page
- Views:
- 8903
- Rating:
- Published:
- Updated:
-
Need a robot or indicator based on this code? Order it on Freelance Go to Freelance
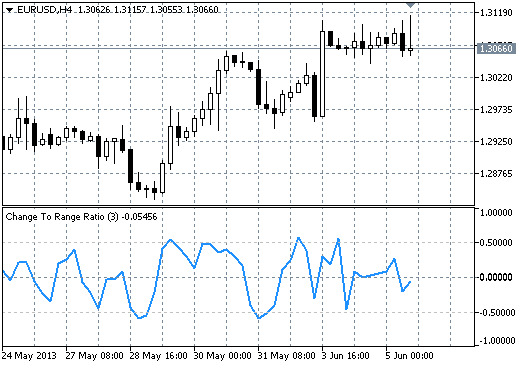
The idea is that the sharper trend movement is, the greater is the momentum, and the closer is the value of the momentum to the sum of the ranges of bars. So the indicator is the ratio of the momentum to the sum of ranges:
Change To Range Ratio = (close[bar] - close[bar-period]) / Sum(high - low)
This indicator is very similar to Range Ratio, but it uses a difference between the closing prices, which provides the following benefits:
- more accurate signals;
- turns the indicator into an oscillator with oversold and overbought areas.
The indicator is designed for short-term trading on high timeframes (H4 and higher), and works well with 3-5 bar period. Values greater than 0.5 indicate an overbought market, and therefore you should close long positions and shouldn't open new ones. Values less than -0.5 warn against opening short positions, or, if there are open new ones, you should close them.

Tips:
- I do not advise to use the indicator with a period of more than 5, as it is designed for short-term systems, so the greater the value of the period - the less reliable is the signal.
- Example of use as a filter: if you receive a buy signal on the timeframe H1, but on the daily chart in an uptrend the value of the indicator is greater than 0.5 - it is recommended to ignore the signal. In other words, intending to enter the market, check the value of ChangeToRangeRatio on a higher timeframe.
Translated from Russian by MetaQuotes Ltd.
Original code: https://www.mql5.com/ru/code/1759
 MTF_MACD_Bars
A semaphore signal indicator showing the MACD histogram calculated on the timeframe specified in the input parameters
 Tro_Range
A simple volatility meter which displays sizes of candlesticks in a separate subwindow
 ATRStops_v1
A trend indicator implemented in the form of NRTR
 Volatility2
A simple indicator that calculates only the volatility of a financial asset