Join our fan page
- Views:
- 4703
- Rating:
- Published:
- Updated:
-
Need a robot or indicator based on this code? Order it on Freelance Go to Freelance
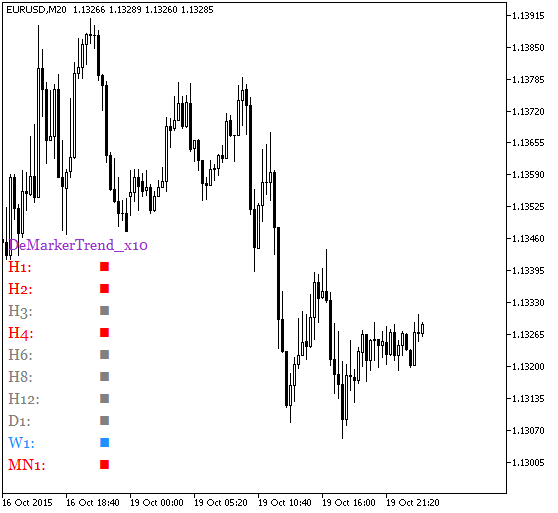
The DeMarkerTrend_x10 indicator shows the DeMarker oscillator position from ten different timeframes.
If the oscillator is positioned lower than the oversold level, the color squares are painted in red, if it's higher than the overbought level, the color squares are painted in light blue. Otherwise, the squares are gray. The indicator uses the values of the last closed bars.
The indicator uses a class of the GetFontName.mqh library (should be copied to the <terminal_data_folder>\MQL5\Include).

Fig.1. The DeMarkerTrend_x10 indicator
Translated from Russian by MetaQuotes Ltd.
Original code: https://www.mql5.com/ru/code/14047
 Exp_LSMA_Angle
The Exp_LSMA_Angle Expert Advisor is based on the LSMA_Angle histogram breakthrough of the overbought and oversold levels
 LSMA_Angle_HTF
The LSMA_Angle indicator with the timeframe selection option available in input parameters
 DeMarkerTrend_x10Full
A variant of the DeMarkerTrend_x10 indicator with the option to individually customize the input parameters for each DeMarker oscillator which are used to display the current trends
 MultiDeMarkerTrend_x10
The MultiDeMarkerTrend_x10 indicator shows information on the current trends using the DeMarker oscillator position from then different timeframes