Join our fan page
- Views:
- 6145
- Rating:
- Published:
- Updated:
-
Need a robot or indicator based on this code? Order it on Freelance Go to Freelance
Real author:
Inkov Evgeni
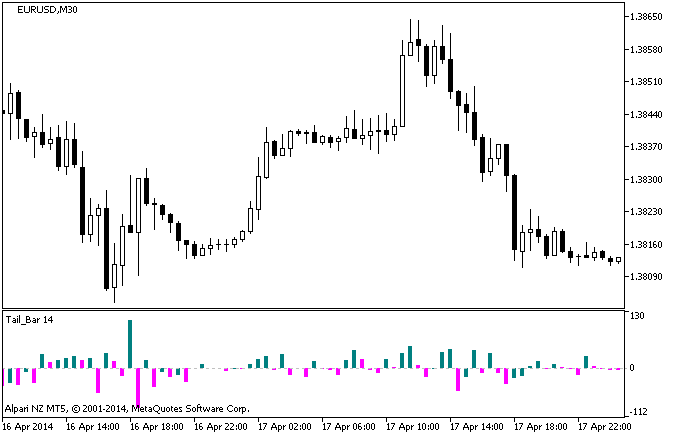
As we know, stars give evidence of the beginning of price reversal. But a candle with asymmetric "tails" can appear instead of a star, which is also an evidence of a fight between "bulls" and "bears".
This indicator shows this difference. If the low tail is bigger the high one, a bar on the histogram will be above the zero line. If the low tail is longer the bar will be at the bottom. Bar amplitude is a difference between tails. The bigger the difference is, the bigger the sign of a reversal and end of a trend. The more vivid sign is appearance of several bars having one direction and large amplitude at a time!
This indicator was first implemented in MQL4 and published in CodeBase on March 31, 2014.

Fig.1. Tail_Bar Indicator
Translated from Russian by MetaQuotes Ltd.
Original code: https://www.mql5.com/ru/code/11248
 TSI_WPR_HTF
The TSI_WPR indicator with the timeframe selection option available in input parameters.
 Karpenko_HTF
The Karpenko indicator with the timeframe selection option available in input parameters.
 TSI_DeMarker
A TSI oscillator based on the values of the DeMarker technical indicator, implemented with its own signal line in the form of a colored cloud.
 TSI_DeMarker_HTF
The TSI_DeMarker indicator with the timeframe selection option available in input parameters.