How to read multi timeframe RSI and divergence for EURUSD scalping

A scalp on EURUSD M1 or M5 lasts minutes, but it lives inside moves that play out on M15, H1 and H4. Multi timeframe RSI is a simple way to see those layers at once: where momentum sits on each timeframe, which way it is turning, and where a divergence suggests a move is losing strength. This article explains a top-down reading of the grid, the difference between regular and hidden divergence, why closed bars matter, and how to put it together with EuroScalper (user guide). The ideas are general and work with any charting setup.
Why more than one timeframe
On a single M5 chart, RSI at 30 can mean two very different things. In a calm range it often marks the low end of a swing. In a strong H1 downtrend it may only be the market catching its breath before the next leg. The M5 reading is the same, the context is not.
A multi timeframe RSI dashboard puts the context next to the trigger. Many scalpers use three layers:
- Direction from H4 and H1: where is the larger move going?
- Setup from M30 and M15: is price pulling back against that move, or stretching with it?
- Trigger from M5 and M1: is short-term momentum turning in the direction you want?
Nothing here is a rule. It is a way to ask the same questions in the same order every time.
Reading the grid from the top down
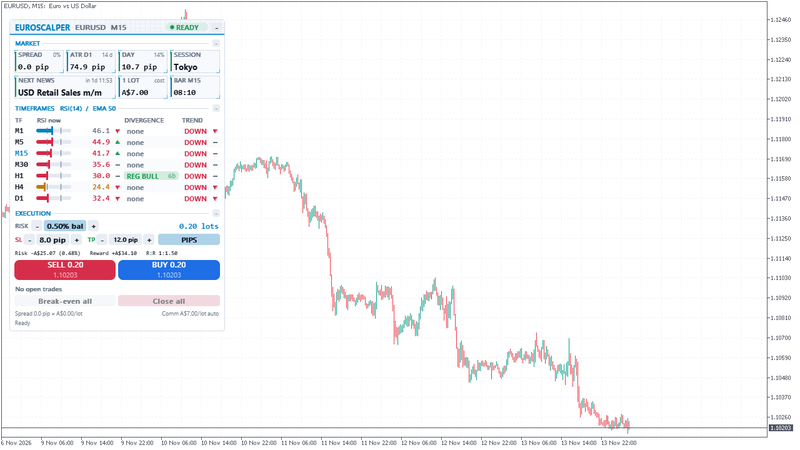
EuroScalper shows one row per timeframe, M1 to D1 by default. Read it from the bottom (D1) to the top (M1):
- 1. Trend column first. UP or DOWN says whether the last closed bar closed above or below EMA 50 on that timeframe, and the small arrow is the EMA's own slope. When H4 and H1 both read DOWN with falling EMAs, the larger move is down.
- 2. Then the RSI values and slopes. Values from 55 to 70 show green and 30 to 45 red; 70 and above or 30 and below show amber, the overbought and oversold zones. The slope arrow compares the last 3 closed bars and ignores small changes, so a flat dash means momentum is not really turning.
- 3. Then divergences. A badge on a higher timeframe matters more than one on M1, which can appear and age out within minutes.
- 4. Finally the trigger rows. M5 and M1 tell you whether short-term momentum agrees with what the upper rows say.
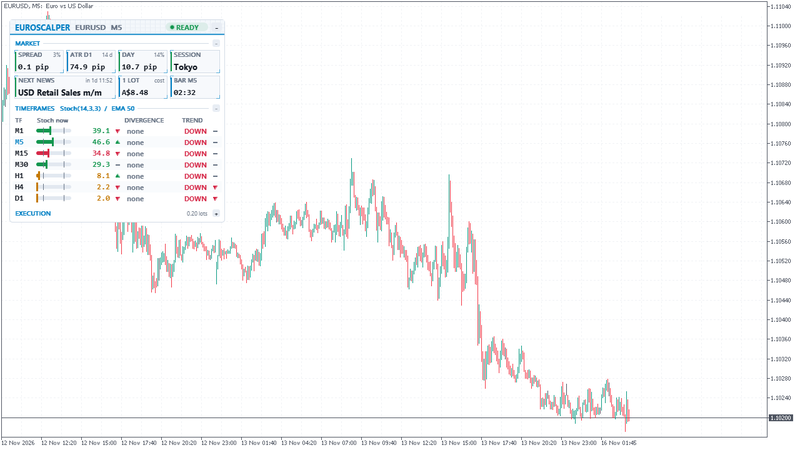
The grid uses RSI 14 by default. You can switch to MACD, Stochastic, CCI or Momentum in the inputs, and the whole grid, slopes and divergences included, follows that oscillator.
Regular and hidden divergence
A divergence compares two swings in price with the same two swings in the oscillator.
- Regular bullish: price makes a lower low, RSI makes a higher low. Selling is losing strength. Often read as a possible turn up, or at least a slowdown of the fall.
- Regular bearish: price makes a higher high, RSI makes a lower high. Buying is losing strength.
- Hidden bullish: price makes a higher low, RSI makes a lower low. Often seen in a pullback inside an uptrend, and read as a sign the trend may resume.
- Hidden bearish: price makes a lower high, RSI makes a higher high. Often a pullback inside a downtrend.
A simple way to remember it: regular divergence argues against the recent move, hidden divergence argues for the larger trend. On the panel, a regular divergence has a filled badge (REG BULL, REG BEAR) and a hidden one an outlined badge (HID BULL, HID BEAR). Hover a badge to see the description and the time of the newer swing.
EuroScalper filters divergences before it shows them: by default a regular divergence needs RSI in the overbought or oversold zone, the line between the swings must be clean (no bar breaks it), the swings must be 5 to 60 bars apart, and the price gap between them must be at least 0.2 ATR. Each filter can be changed in the inputs. Fewer signals pass, and the ones that pass are easier to see on the chart.
Closed bars and why repainting misleads
A swing low is only a swing low once price has moved away from it. EuroScalper needs 3 closed bars after a swing (the "bars after a swing" input) before it confirms one, so a divergence appears on the panel 3 bars or more after the low or high it is built on. The badge shows how long ago the divergence was confirmed, in closed bars: "new" when the last closed bar confirmed it, "2b" when that happened two closed bars ago.
Some divergence tools draw a signal on the forming bar and remove it if the bar does not finish the way it started. In a screenshot or a backtest that looks precise, because you only see the signals that survived. In live trading you would have seen, and maybe traded, the ones that vanished. That is repainting, and it makes a tool look better on history than it can be in real time.
EuroScalper finds divergences on closed bars only. Once a divergence is on the panel it never changes or disappears; it only ages, and drops off when it passes the age limit (24 bars on M1 to H1, 12 on H4, 10 on D1 by default). Slopes and the trend column use closed bars too. The one live number is the oscillator value, which shows the forming bar by default; set "Show the forming bar's value" to false if you want every cell on closed bars.
The cost of not repainting is lateness. A confirmed divergence is never at the exact low. That is the honest price of a signal you can trust not to move.
Worked example 1: a regular bullish divergence against the trend
Say the grid reads like this on a Friday afternoon:
- H4 and D1: RSI around 25 to 33, trend DOWN with falling EMAs.
- H1: RSI 28.7, oversold, trend DOWN, and a REG BULL 2b badge: price made a lower low, RSI a higher low, confirmed two closed H1 bars ago.
- M15 and M30: RSI 33, red, slopes flat.
- M5: RSI 42, falling. M1: RSI 48, rising.
Reading top-down: the larger move is clearly down. The H1 divergence says the selling is losing strength, not that the trend has turned. For a scalper this suggests two things. First, short scalps into an oversold H1 with a fresh bullish divergence carry more risk of a sharp bounce than usual. Second, a long scalp here is a counter-trend trade: it needs a trigger on M5 or M1 (RSI turning up from below 50, slope arrow up) and a tight plan, because the H4 and D1 trend can resume at any time.
Neither reading tells you what price will do. The grid only makes the conflict visible before you click.
Worked example 2: a hidden divergence with the trend
Now picture H4 and H1 reading UP with rising EMAs, RSI on H1 at 58. Price pulls back on M15, RSI there drops to 40, and a HID BULL badge appears on M15: price made a higher low, RSI a lower low. This is the classic hidden divergence setup: a pullback inside an uptrend where the oscillator dipped further than price did.
A trend-following scalper might wait for M5 RSI to turn back above 50 with a rising slope, then look for a long with the stop below the M15 swing low. The panel's execution section sizes that trade from your risk and the stop distance, so the lot size changes with the stop instead of staying fixed.
Other oscillators
Stochastic reaches its extremes quickly, so on a falling day most rows can sit in the oversold zone at once. That is information too: it says the move is stretched on every timeframe, not that a reversal is due. CCI and MACD have no fixed range; the gauge scales them to their recent values. Stick with one oscillator long enough to learn how its grid looks on normal days, before you trust how it looks on unusual ones.
A short checklist
- Read the trend column and the higher rows before the M1 and M5 rows.
- Treat a regular divergence against a strong higher-timeframe trend as a warning, not an entry.
- Prefer hidden divergences that agree with the H1 and H4 trend for trend-following scalps.
- Remember every badge is a few bars late on purpose, and check its age.
- Check the conditions light and the spread before any of it: the grid says nothing about costs or news. The article EURUSD scalping costs covers that side.
EuroScalper is available for MT5 and MT4. More on euroscalper.com.
Risk note: trading forex and CFDs carries a high risk of loss. Divergences and multi timeframe readings are context for your decision, read together with price, levels and your own plan; they work best when the higher timeframes agree. The examples above are illustrations, not trade recommendations. Test any approach on a demo account first, and never risk money you cannot afford to lose.