Rigid Volume Profile: reading where buyers and sellers actually traded

Introduction
Most charts give you one volume number per bar. It tells you how much changed hands while that bar formed, and nothing about where inside the bar it happened, or who was doing it.
A volume profile answers the first question by turning the picture sideways. Instead of one bar of volume per unit of time, it measures volume per unit of price: how much trading happened at 1.1610, how much at 1.1605, how much at 1.1600. The result is a shape beside the candles, and the shape tells you which prices the market kept coming back to and which it passed through in a hurry.
Rigid Volume Profile answers the second question as well. Every price row is split into buying volume and selling volume, so you can see not only that a price was busy, but which side was doing the business there.
This post is about reading the picture. The companion manual covers every setting one by one.
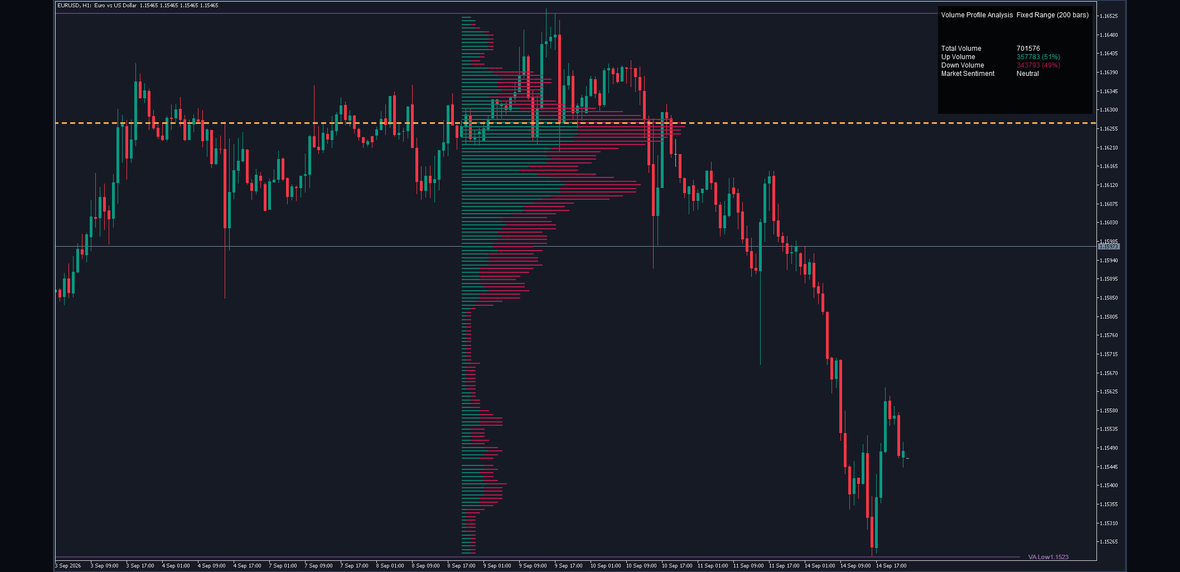
Rigid Volume Profile on a EURUSD M5 chart at its shipped defaults.
What It Draws
Five things, and nothing else.
A row of volume at every price level, split into a buying part and a selling part, with the longest rows at the prices where most trading happened.
The Point of Control, a dashed amber line through the single busiest row, with its price on a tag at the right.
The value area, the band of prices that together hold 70 percent of all the volume in the window. Its high and its low are drawn as lines and tagged with their prices.
An optional delta mark beside any row where one side holds clearly more than the other, coloured for the side that dominates.
A volume table reporting the totals: all volume, buying volume with its share, selling volume with its share, and a one-word reading of which side is ahead.
How the Grid Is Built
The word rigid in the name is the important one, and it describes the grid.
The indicator looks back over a fixed number of bars, 200 by default. It finds the highest high and lowest low in that window, and cuts the distance between them into equal rows, 150 of them by default. Every row is exactly the same height, and it keeps that height no matter how the volume falls inside it.
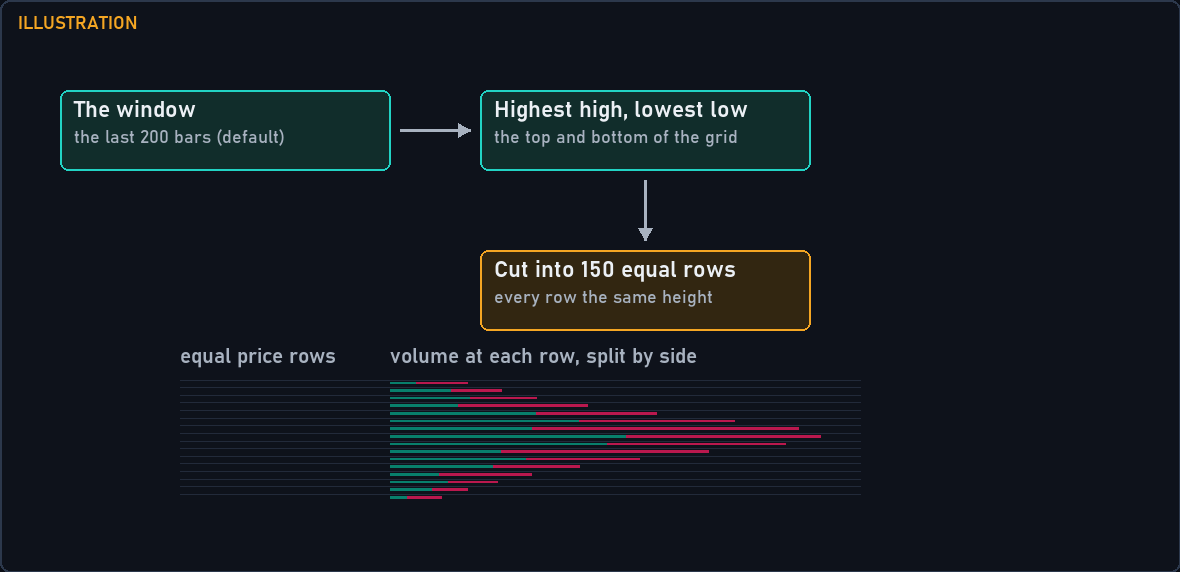
Illustration of the rule: the window's high and low fix the top and bottom, and the distance between them is cut into equal rows of identical height.
That sounds obvious until you compare it with the alternative. Some profiles let their rows move or resize to follow clusters in the data. Those look tidier, and they are much harder to compare: the same price sits in a different row from one bar to the next, and two charts at the same setting are not measuring the same thing.
Here the grid is fixed by the window's extremes and nothing else, so the same price sits on the same row until the window itself moves, and two charts on the same setting are directly comparable.
Each bar in the window is then walked through every row its high-to-low range touched. A bar that spans eight rows contributes to all eight, and each row receives the fraction of the bar that lies inside it: a row covering a quarter of the bar's range receives a quarter of its volume.
Buying and Selling Volume
Here is where this profile differs from most.
Once a bar's share of volume has been worked out for a row, the whole of that share goes to one side. If the bar closed above its open, it counts as buying. If it closed below, it counts as selling. If open and close are equal, the share splits evenly between the two.
This is a deliberately blunt rule, and it is worth being honest about what it is and is not. It does not know who bought and who sold. Every trade has both. What it measures is whether the bars that traded at a price were rising bars or falling bars.
That is still useful. A price level where almost all the volume came from rising bars is a level buyers were willing to pay up for. A level where it came from falling bars is one sellers were willing to let go at. When the two are roughly equal, the level was fought over.
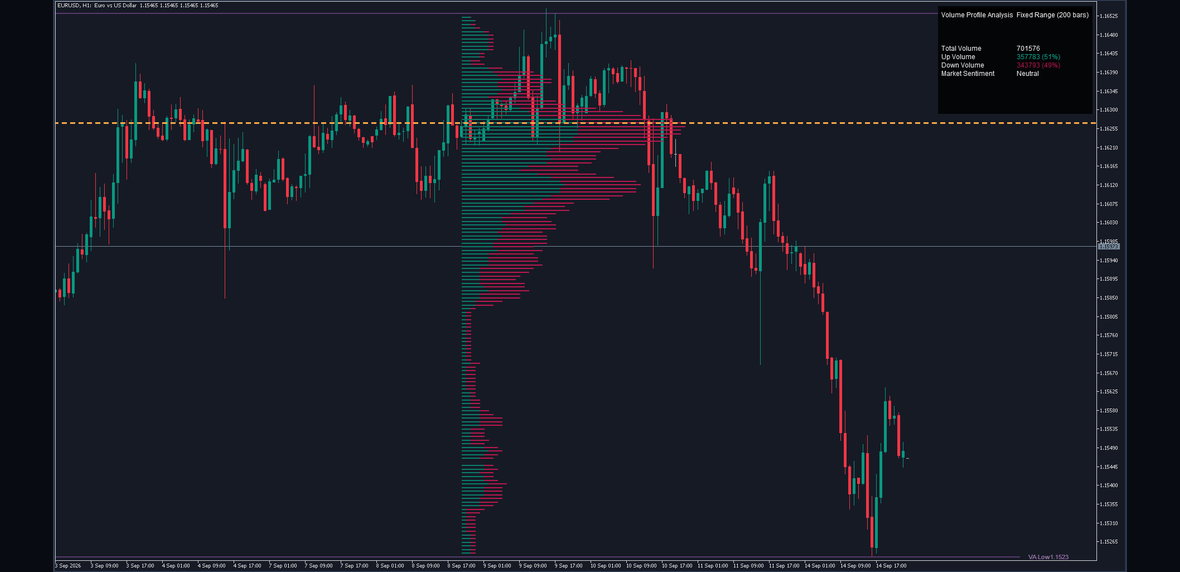
A real chart: each row is split, buying volume in teal and selling volume in crimson.
The practical reading is comparative, not absolute. Look for rows where the split is lopsided, and compare them with the rows above and below. A single row that is nearly all one colour in the middle of a balanced profile is more interesting than a whole profile tilted one way, which usually just reflects the direction of the window.
The Point of Control
The Point of Control is the row with the most total volume in the window: the single price at which most trading happened. Where two rows hold exactly the same volume, the lower one wins.
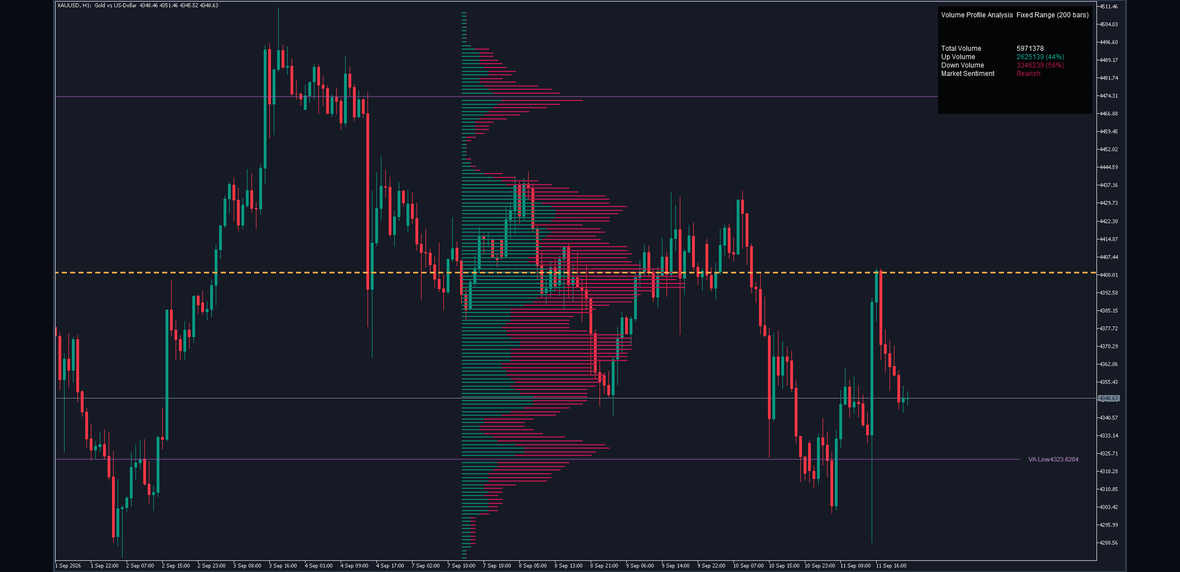
A real chart: the dashed amber line marks the busiest price row, tagged with its price.
It is drawn as a dashed amber line running back across the window and forward past the last bar, so it stays readable as new bars arrive. Its colour is fixed and is not the POC Color setting, which colours the price tag.
What traders generally do with it is treat it as a centre of gravity for the window: the price the market has spent the most effort agreeing on. Price returning to it from either side is common. Price leaving it and not coming back is how a window ends up with its next Point of Control somewhere else.
None of that is a rule, and none of it is a forecast. The line says where volume has already been heaviest. What price does next is not in the measurement.
The Value Area
The value area answers a different question: not where was the single busiest price, but where was the bulk of the business.
It is built by taking the rows in order of volume, largest first, adding them up, and stopping when the running total reaches 70 percent of the volume in the window. The highest and lowest prices among the rows taken are the value area high and the value area low.
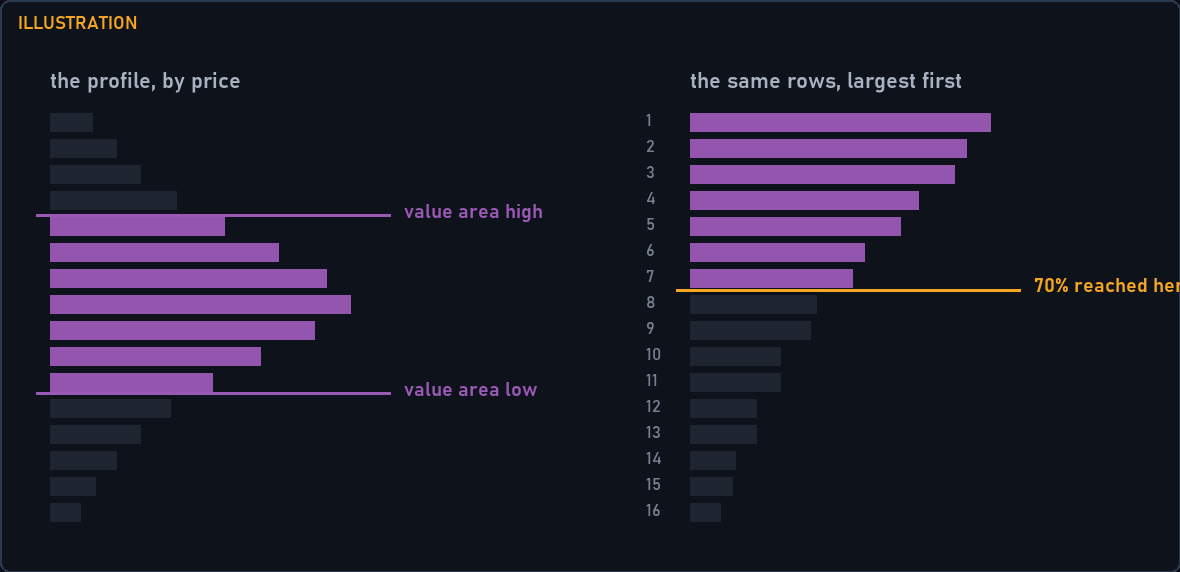
Illustration of the rule: rows are taken largest first until seventy percent of the window's volume is accounted for, and the band's top and bottom are drawn.
The two lines are drawn in violet and tagged with their prices. When the profile is mirrored they are dotted rather than solid; that is a property of the drawing, not of the measurement.
A narrow value area means the window's trading was concentrated: most of it happened in a small band of prices. A wide one means it was spread out. The edges are the prices where the market stopped doing most of its business, which is why they are watched as reference levels, not as signals.
Display Modes
Three layouts, and they suit different questions.
Side by Side is the shipped default. Buying and selling run end to end from a common start, so the total length of a row is its total volume and the join between the colours shows the split. Use it to read the overall shape and the split at once.
Split puts the start of each row at the middle of the window and runs buying to the right and selling to the left of it. The two sides are then directly comparable at a glance, at the cost of the shape being harder to read as one profile.
Stacked draws buying and selling as two separate rows a fraction apart, each measured from the same start. Use it when you care about one side at a time.
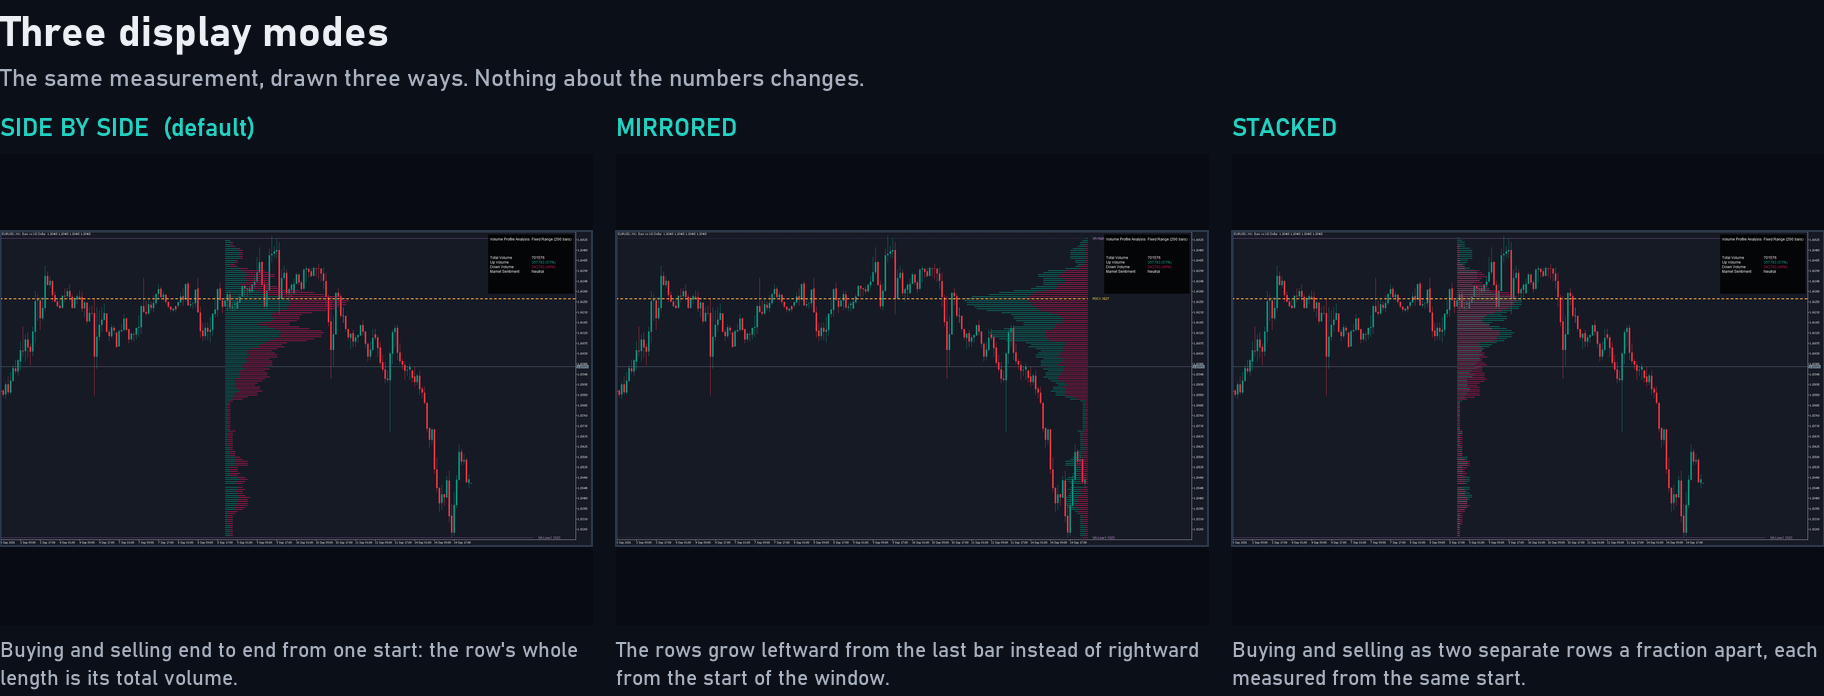
The same window drawn in each of the three display modes.
Mirror Profile flips the drawing so the rows grow leftward from the last bar instead of rightward from the start of the window. It changes nothing about the numbers. Note that in Split mode it has no effect at all, because both halves of that layout are drawn the same way.
The Volume Table
The table gives you the totals the shape cannot.
Total Volume is all the volume in the window, rounded. Up Volume and Down Volume give each side's total with its share as a percentage. Market Sentiment reads Bullish, Bearish or Neutral: bullish when buying is above fifty-five percent of the window, bearish when selling is, and neutral in between.
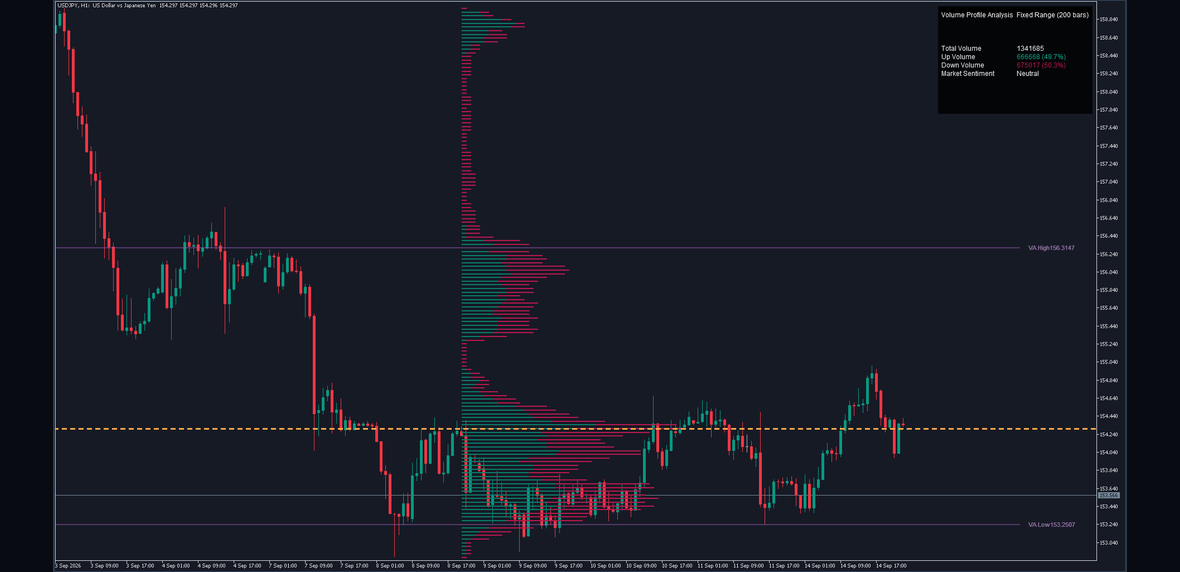
A real chart with the table in its default position.
The table can sit in any of nine positions and at four sizes, so it can be kept out of the way of the candles.
The fifty-five percent threshold is worth knowing, because it means the table reads Neutral for a genuinely wide band. A window that is fifty-four percent buying is not called bullish, and that is intentional: the reading is meant to flag a clear tilt, not a narrow one.
Settings That Change the Picture
Four settings change what you see more than the rest.
Fixed Analysis Period (200) is how many bars the profile measures. Shorter reacts faster to the current session and throws away context; longer gives a stabler picture that is slower to notice a change of regime.
Profile Resolution (150) is how many price rows the range is cut into. More rows give finer price detail on the same range, which matters when the window is wide. Fewer rows give a blunter, smoother shape.
Volume Filter (%) (0.5) hides rows holding less than that percentage of the busiest row's volume. At the default almost everything is kept. Raising it strips the thin tails and leaves only the rows that carry weight, which is often the fastest way to make a cluttered profile readable.
Profile Width (%) (25) is purely cosmetic: how far across the chart the longest row reaches, as a percentage of the window. It changes no measurement.
One more is worth a note. Use Visible Range replaces the fixed bar count with whatever is on screen, capped by Max Visible Range Bars (1000). It is convenient, and it means the profile changes when you scroll or zoom, so two people looking at the same chart at different zoom levels are not looking at the same profile.
Worked Example
Take the EURUSD M5 chart in the first figure, at the shipped defaults.
The window is the last 200 bars. Over those bars the highest high was 1.16175 and the lowest low 1.15901, so the range is 0.00274. Cut into 150 rows, each row is 0.00274 divided by 150, which is 0.0000183, a little under two tenths of a pip.
Every one of those 200 bars is then walked through the rows its range covered, its volume shared out by overlap, and each share put on the buying or the selling side by that bar's own direction.
The busiest row came out at 1.16096, and that is where the Point of Control line is drawn. The value area built from the largest rows down reached seventy percent of the window's volume after taking 63 rows, running from 1.16031 at the bottom to 1.16162 at the top.
So the readable summary is: trading concentrated in a band about thirteen pips wide, centred a little above the middle of a twenty-seven pip range, with its busiest single price near the centre of that band. The table reported the window close to balanced, which is why its sentiment cell read Neutral.
That is the whole measurement. Nothing in it says what comes next.
Ten-Second Read
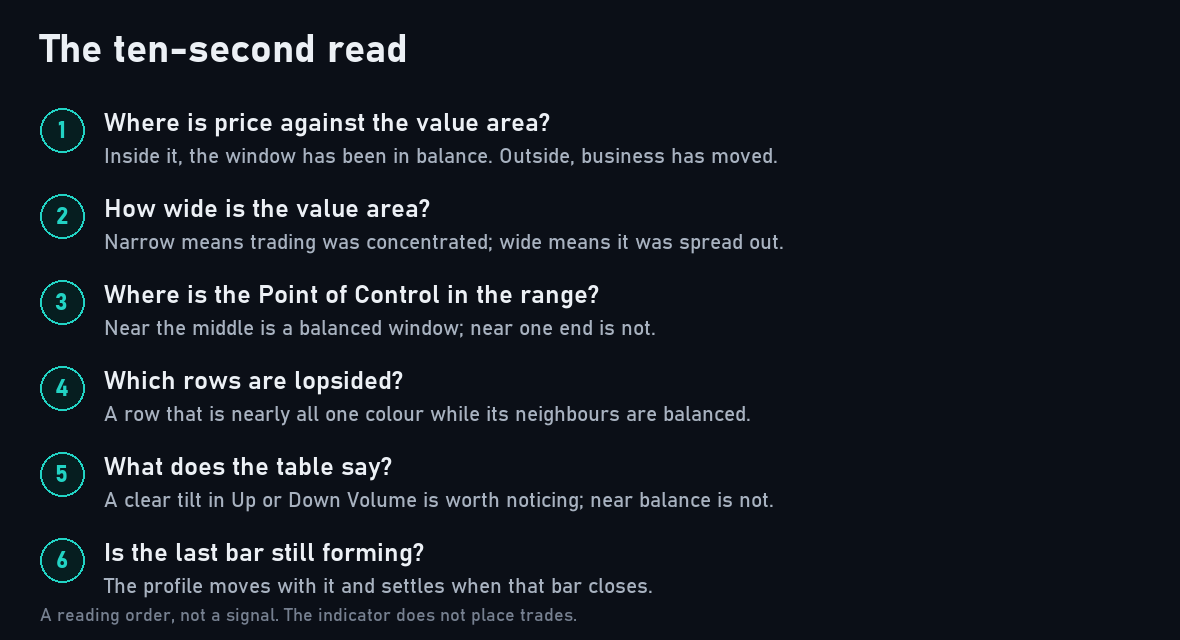
The four things worth checking first.
- Where is price relative to the value area? Inside it, the window has been in balance. Outside it, the market has recently been doing business somewhere it previously did not.
- How wide is the value area? Narrow means concentrated trading, wide means spread out.
- Where is the Point of Control, relative to the middle of the range? Near the middle is a balanced window. Near one end means the heaviest trading happened at one extreme of the range.
- What does the table say? A clear tilt in Up or Down Volume is worth noticing; anything near balance is not.
Mistakes
Treating the Point of Control as a signal. It is the busiest price in the window and nothing more. It becomes a level people watch because people watch it, not because the measurement says anything about direction.
Forgetting the window moves. At the default the profile measures the last 200 bars, so it is recomputed as bars arrive and the shape you looked at an hour ago is not the shape now. That is the design, but it does mean a level you noted earlier may no longer be on the current profile.
Reading a lopsided profile as a lopsided market. A window that spent most of its bars trending up will show mostly buying volume, because most of its bars closed above their opens. That is arithmetic, not information. The interesting cases are rows that disagree with the rows around them.
Pushing the resolution up and expecting more information. Above a certain point you are cutting the same volume into thinner and thinner rows, and the shape gets noisier rather than more detailed. From 167 rows the drawing reaches its own limit and the lowest-priced rows stop being drawn; the manual explains why, and it is reproduced deliberately.
Comparing profiles across different Fixed Analysis Period settings. Two windows of different lengths are two different measurements, and their Points of Control are not comparable.
What It Does Not Do
It does not place trades. It measures and draws; every order is yours.
It gives no buy or sell signal at all. There are no arrows, no markers, no entries, no stops and no targets. The Point of Control and the value area edges are reference levels, not instructions, and what they mark is not a forecast.
It does not see the future. The profile is measured on the last bar on the chart, and that bar's volume is still changing. On the forming bar the rows, the Point of Control, the value area and the table all move as volume arrives, and the picture settles when that bar closes.
It reads your broker's tick volume on symbols where the feed reports no exchange volume, which is most forex symbols. That is a count of price changes, not of contracts, and two brokers will not report the same count for the same bar. The shape of a profile is generally similar across feeds; the absolute numbers in the table are not.
The Point of Control line and the three price tags are drawn past the last bar by design, so give the chart room on the right with the chart shift control if you want them clear of the candles.
Conclusion
A volume profile is a measurement, not a method. What Rigid Volume Profile measures is clearly defined: a fixed grid of equal price rows over a fixed window of bars, each bar's volume shared out by overlap and assigned to a side by its own direction, the busiest row marked, and the band holding seventy percent of the volume drawn.
Everything in the picture follows from those rules, and nothing in it is an opinion about what happens next. Used that way, as a map of where business has already been done, it is a useful thing to have beside the candles.
Risk Disclaimer
Trading leveraged products carries a high level of risk and may not be suitable for all investors. Rigid Volume Profile is an analysis tool, not financial advice. It gives no signals and places no orders, and nothing it draws is a recommendation to buy or sell. Test it on a demo account first, and never risk money you cannot afford to lose.