

What Rigid Volume Profile Is
Rigid Volume Profile is a chart indicator for MetaTrader. It measures how much volume traded at each price level over a window of bars, splits that volume into buying and selling, and draws the result as a horizontal profile beside the candles, with a Point of Control, a seventy percent value area and a volume table.
It does not place trades and it gives no buy or sell signal. The lines it draws are reference levels, and what they mark is not a forecast.
This manual covers installation and every setting. The companion trading guide covers how to read the picture.
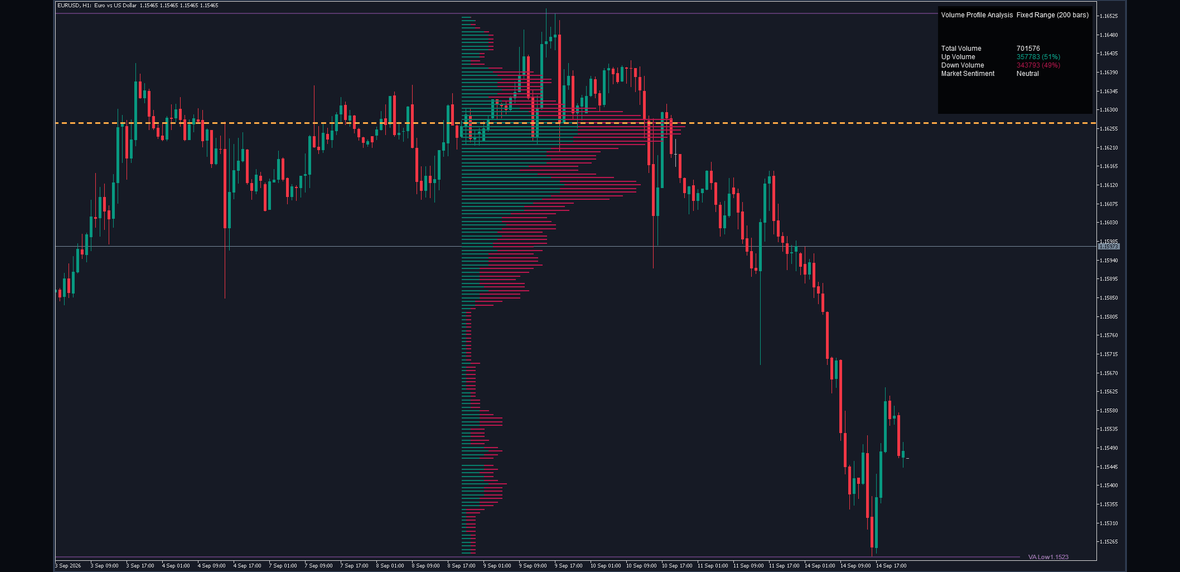
Rigid Volume Profile on a EURUSD M5 chart at its shipped defaults.
Installation
After purchase the indicator appears in your terminal automatically.
- Open the terminal and log in with the account the purchase is attached to.
- Open the Navigator panel (Ctrl+N).
- Expand Indicators, then Market. Rigid Volume Profile is listed there.
- Drag it onto a chart, or double-click it.
- The settings dialog opens. Change what you want and press OK.
If it is not in the list, right-click Indicators in the Navigator and choose Refresh. If it is still missing, check that the terminal is logged in with the right account.
To change a setting later, right-click the chart, choose Indicators List, select Rigid Volume Profile and press Edit. The keyboard shortcut for the list is Ctrl+I.
What You See
Volume rows. One horizontal bar per price row, split into a buying part and a selling part. The longer the row, the more volume traded at that price.
The Point of Control. A dashed amber line through the busiest row, with its price on a tag. Its colour is fixed and is not the POC Color setting; that setting colours the tag.
The value area. Two violet lines marking the top and bottom of the band of prices holding seventy percent of the window's volume, each with its price on a tag. They are drawn solid normally and dotted when the profile is mirrored.
Delta marks. Optional short marks beside rows where one side clearly dominates, in their own colours. Off by default.
The volume table. Total volume, buying volume and its share, selling volume and its share, and a sentiment cell reading Bullish, Bearish or Neutral. It can sit in any of nine positions and at four sizes.
The Point of Control line and the three price tags are drawn past the last bar by design. Use the terminal's chart shift control to leave room on the right if you want them clear of the candles.
When It Is Calculated
The profile is measured on the last bar on the chart, and only there. It is rebuilt whenever that bar's volume changes, so on the forming bar the whole picture moves as trades arrive, and it settles when that bar closes.
Nothing is drawn for historical bars. If you scroll back, the profile you see still describes the window ending at the last bar on the chart, not the bars under your cursor.
Volume is whatever your broker reports. On symbols where the feed carries no exchange volume, which is most forex symbols, that is tick volume: a count of price changes rather than of contracts. Two brokers will not report the same count for the same bar, so the table's absolute numbers are feed-dependent even when the shape is similar.
Inputs
Every setting, with the default it ships with and the range it accepts. The tables below are generated from the shipped source, and a separate check reads them back and compares every cell with that source, so a value here cannot drift away from the build.
Lookback Period
| Setting | Default | Allowed | What it does |
|---|---|---|---|
| Use Visible Range | false | true or false | Measure whatever bars are on screen instead of a fixed count. The profile then changes when you scroll or zoom. |
| Fixed Analysis Period | 200 | 50 to 2000 | How many bars the profile measures when Use Visible Range is off. |
| Max Visible Range Bars | 1000 | 100 to 2000 | The cap on the bar count when Use Visible Range is on. |
Bull/Bear Volume
| Setting | Default | Allowed | What it does |
|---|---|---|---|
| Show Bull/Bear Volume | true | true or false | Split each row into buying and selling. With it off, each row is one neutral bar of total volume, and the profile is drawn from a different starting bar. |
| Display Mode | Side by Side | Split, Side by Side or Stacked | Side by Side runs the two sides end to end from one start; Split runs them in opposite directions from the middle of the window; Stacked draws them as two rows a fraction apart. |
| Show Volume Delta | false | true or false | Draw a short mark beside rows where one side clearly dominates. |
| Delta Threshold | 0.5 | 0.2 to 0.9 | How lopsided a row has to be before it gets a delta mark. |
Core
| Setting | Default | Allowed | What it does |
|---|---|---|---|
| Profile Resolution | 150 | any value | How many price rows the window's range is cut into. See Resolution and the Drawing Limit. |
| Show Value Area | true | true or false | Draw the value area lines and tags. With it off the value area is not calculated at all. |
| Show POC Line | true | true or false | Draw the Point of Control line and its price tag. |
| Volume Filter (%) | 0.5 | 0 to 10 | Hide any row holding less than this percentage of the busiest row's volume. |
| Extend Lines | true | true or false | Run the Point of Control and value area lines past the last bar. |
Appearance
| Setting | Default | Allowed | What it does |
|---|---|---|---|
| Profile Width (%) | 25 | 25 to 150 | How far across the chart the longest row reaches, as a percentage of the window. Cosmetic only. |
| Bar Thickness | 2 | 1 to 8 | The thickness of each volume row, in pixels. |
| Mirror Profile | false | true or false | Draw the rows growing leftward from the last bar. No measurement changes. In Split mode it has no effect. |
Colors
| Setting | Default | Allowed | What it does |
|---|---|---|---|
| Bullish Volume | C'8,127,108' | any colour | The colour of buying volume. |
| Bearish Volume | C'186,24,78' | any colour | The colour of selling volume. |
| Neutral Volume | C'255,255,255' | any colour | The colour of the single total bar when Show Bull/Bear Volume is off. |
| POC Color | C'255,193,7' | any colour | The colour of the Point of Control's price tag. The line itself is a fixed amber. |
| Value Area | C'155,89,182' | any colour | The colour of the two value area lines and their tags. |
| Bull Dominance | C'8,127,108' | any colour | The colour of a delta mark where buying dominates. |
| Bear Dominance | C'186,24,78' | any colour | The colour of a delta mark where selling dominates. |
Table
| Setting | Default | Allowed | What it does |
|---|---|---|---|
| Show Volume Analysis Table | true | true or false | Draw the table of totals. |
| Table Position | Top Right | Top Left, Top Center, Top Right, Middle Left, Middle Center, Middle Right, Bottom Left, Bottom Center or Bottom Right | Which of the nine positions the table sits in. |
| Table Size | Normal | Tiny, Small, Normal or Large | The table's text size. |
MetaTrader
| Setting | Default | Allowed | What it does |
|---|---|---|---|
| MT4 Object Budget (0 = measured default) | 0 | any value | MetaTrader 4 only. Caps how many profile lines are drawn on a terminal that limits chart objects. Zero means no cap, which is the measured default. |
| Debug Log | false | true or false | Print one line per calculation to the Experts tab. Useful when reporting a problem. |
Resolution and the Drawing Limit
From 167 rows the profile reaches its own drawing limit, and the lowest-priced rows stop being drawn.
The reason is in the design the indicator reproduces. Each price row needs three drawing objects, plus one for the Point of Control and two for the value area. At 167 rows that is 504 objects, and the drawing system keeps 501. At the maximum of 400 rows it is 1,203 objects, of which 702 are discarded, and because they are created from the lowest price upward, the ones lost are at the bottom.
This is reproduced deliberately rather than corrected. The alternative would be to draw rows the specification does not, which would make this build show a different picture from the one it is meant to match.
The practical advice: resolutions up to 166 draw the whole profile. From 167 the top of the profile is complete and the bottom is cut. If you want fine price detail over a wide range, consider shortening Fixed Analysis Period instead, which narrows the range being cut up.
Performance
The indicator calculates on one bar, so its cost does not grow with chart history.
On MetaTrader 5 the profile is painted as a single image above the candles, so there is no object count to run out of and the highest resolution costs no more than the lowest.
On MetaTrader 4 it is drawn as chart objects. A redraw at the profile's maximum of 1,203 objects was measured at 2.35 milliseconds, against 3.20 milliseconds at 120,000 objects, so a scroll or a zoom at any setting is not something you will notice.
The terminal's own Max bars in chart setting, in Tools then Options then Charts, limits how much history the chart holds. It does not change what the profile measures, which is a fixed count of recent bars, but a very low value can leave fewer bars on the chart than the analysis period asks for, and then nothing is drawn until enough bars have loaded.
Troubleshooting
Nothing is drawn. The chart has fewer bars than Fixed Analysis Period. Scroll left to load history, or lower the setting.
The profile is in the way of the candles. Lower Profile Width, or switch on Mirror Profile to draw it from the right-hand side instead.
The lines and tags are off the right edge. They are drawn past the last bar by design. Increase the terminal's chart shift, or switch off Extend Lines.
The profile looks like a solid block. The resolution is high for the range on screen. Lower Profile Resolution, or raise Volume Filter to hide the thin rows.
The bottom of the profile is missing. Profile Resolution is above 167. See the section above.
The table overlaps something. Move it with Table Position, or shrink it with Table Size.
On MetaTrader 4 the Point of Control line looks solid, not dashed. MetaTrader 4 draws a dashed line only at thickness one. Set Bar Thickness to 1 if you want the dashes; otherwise it stays solid.
On MetaTrader 4 the rows are opaque where they should be translucent. MetaTrader 4 cannot draw transparent chart objects. The MetaTrader 5 edition does.
Frequently Asked Questions
Does it repaint? The profile is measured on the last bar on the chart and rebuilt as that bar's volume changes, so it moves while the bar is forming and settles when that bar closes. Nothing is drawn for historical bars, so there is no history to revise.
Can I use it on any symbol and timeframe? Yes, from M1 to monthly, on forex, metals, indices and crypto. It reads only the chart it is attached to.
Why does my profile differ from someone else's on the same pair? Different brokers report different tick volume for the same bar, and different history. The shape is usually similar; the numbers are not identical.
Why is the Point of Control line a different colour from the POC Color setting? The line's colour is fixed by design. POC Color sets the colour of its price tag.
Does it need an internet connection or a DLL? No. It uses no DLL, makes no network request and writes no files.
Can I run several copies on one chart? Yes, with different settings. Each draws its own profile.
Support
Questions and problems go through the product's Comments (Discussion) tab on its page, so other users can see the answer too. Include your symbol, timeframe, terminal build and the settings you are using. If something looks wrong, switch Debug Log on, reproduce it, and paste the lines it prints.
Version History
1.00 First release. MetaTrader 4 and MetaTrader 5 editions, built from one shared calculation.
Risk Disclaimer
Trading leveraged products carries a high level of risk and may not be suitable for all investors. Rigid Volume Profile is an analysis tool, not financial advice. It gives no signals and places no orders, and nothing it draws is a recommendation to buy or sell. Test it on a demo account first, and never risk money you cannot afford to lose.