
This article is for informational and educational purposes only. It does not constitute financial advice or an investment recommendation. Trading in financial markets carries a high risk of loss.
Introduction
Volume on its own says little: a busy bar can push price strongly or barely move it. What makes volume useful is comparing it with what price did on the same bar. This idea, known as effort versus result, comes from the work of Richard Wyckoff and is still one of the most practical ways to read volume.
This article is divided into three sections. The first explains the idea of effort and result. The second shows how to measure both in MetaTrader 5 so that bars can be compared. The third covers how to use it with care, including a step-by-step example and the most common mistakes.
1. Effort and result
Two questions for every bar
The effort is the volume: how much activity there was during the bar. The result is what price achieved: how far it moved. When both are in line, the bar is easy to interpret. When they disagree, the bar is telling you something the price alone does not show.
| Effort | Result | Usual reading |
|---|---|---|
| High | Large | The move has participation behind it |
| High | Small | Someone is absorbing the pressure; the move may be stalling |
| Low | Large | Little opposition, or a move in thin liquidity |
| Low | Small | A quiet market, waiting |
These are general tendencies. The location of the bar changes their meaning, as explained in section 3.
Absorption: high effort, small result
The most useful case is a bar with very high volume and a narrow range. If buyers are pushing hard and price hardly advances, someone on the other side is selling enough to absorb that buying. At a resistance level, after a long rally, it can be an early sign that the move is running out.
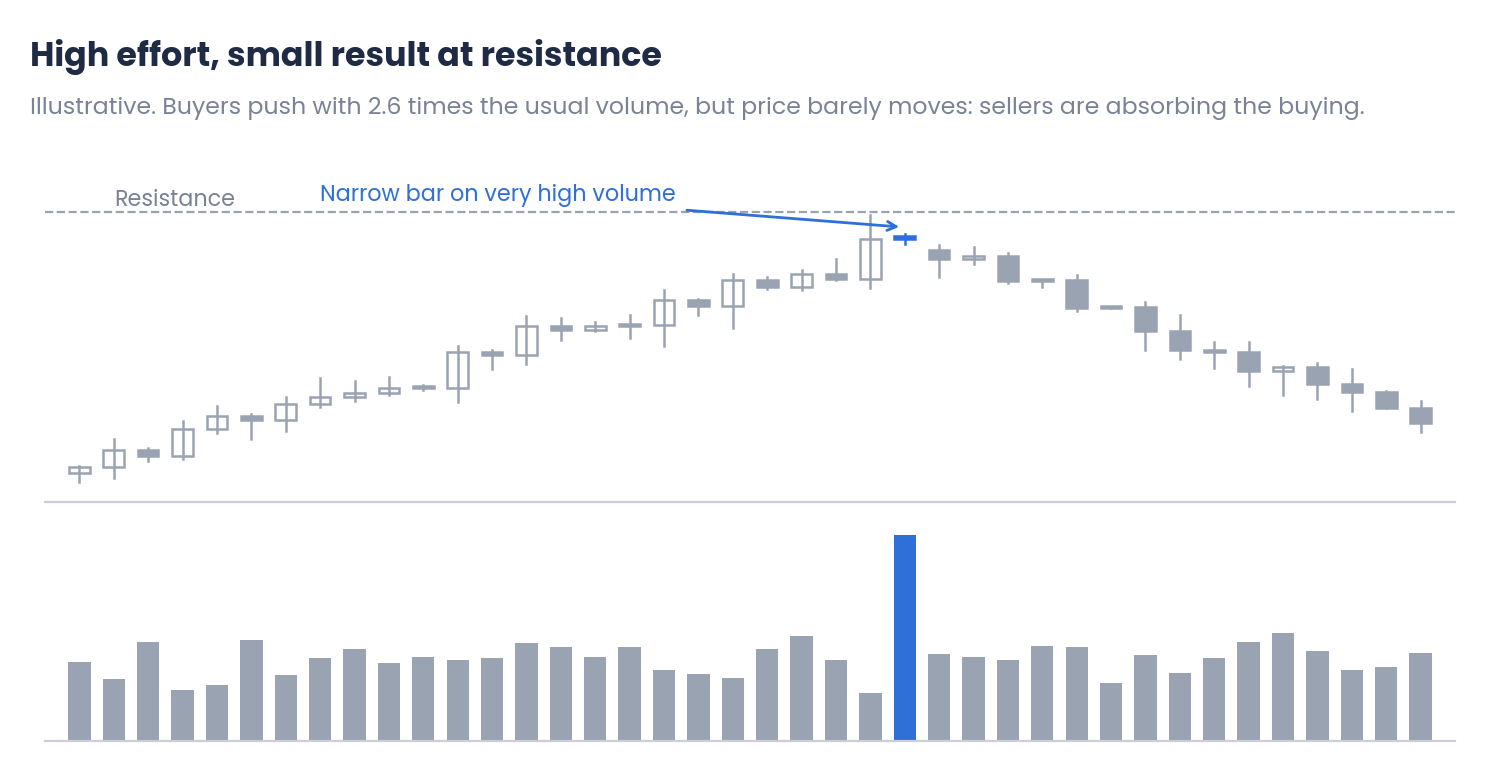
Figure 1. A narrow bar on very high volume at resistance (illustrative)
The same idea works in reverse at support: heavy selling that fails to push price lower suggests that buyers are absorbing it.
Effort across a whole move
The comparison is not limited to single bars. Comparing two legs of a trend is often even more informative.
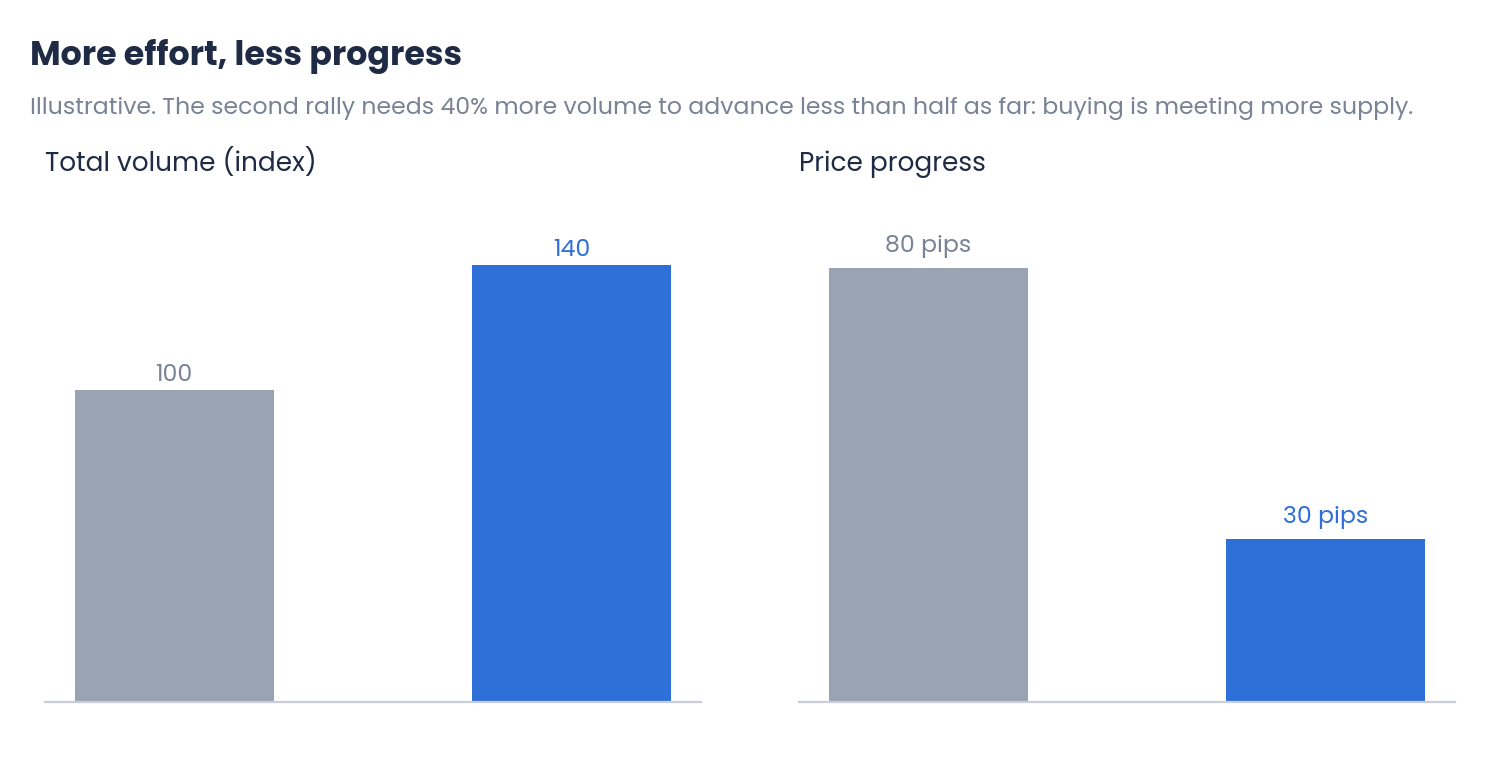
Figure 2. Volume and price progress of two rallies (illustrative)
If each new rally needs more volume to advance less, the buying is meeting more and more supply. The trend may continue for a while, but it is becoming harder for it to make progress.
2. Measuring effort and result in MT5
Make both values relative
Raw values cannot be compared from one bar to another or from one symbol to another. Both need to be expressed relative to their own normal level:
Effort = Tick volume of the bar ÷ Average tick volume of the last 20 bars
Result = Range of the bar (high − low) ÷ ATR
A value of 1 means a normal bar in both cases. On most forex pairs and CFDs, MT5 shows tick volume, which reflects activity rather than the amount traded; the article on tick volume explains what it measures and how far it can be trusted. The ATR, and how its period affects the result, is covered in the article on ATR volatility.
Mapping the bars
With both values relative, every bar becomes a point on a simple map.
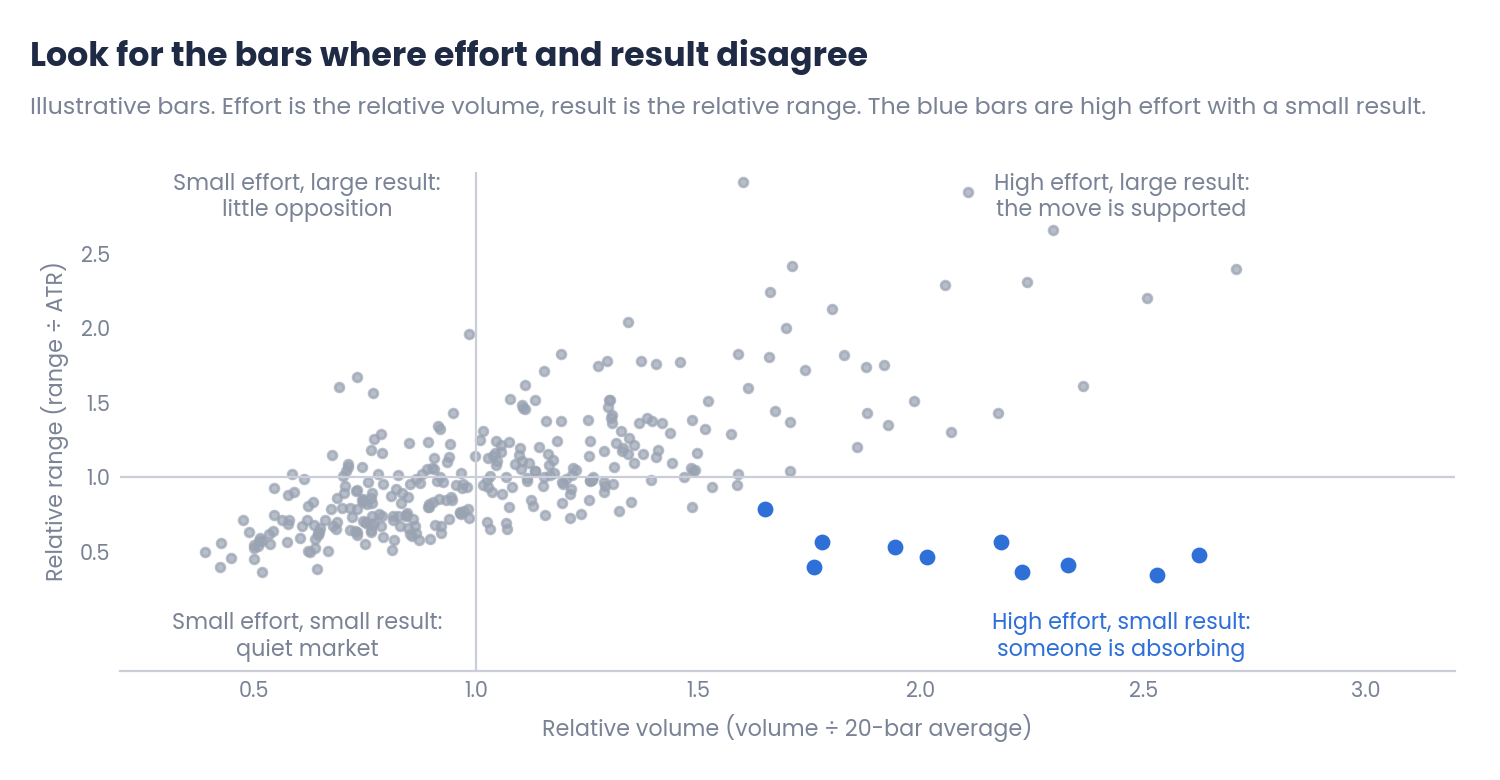
Figure 3. Effort and result of a set of bars (illustrative)
Most bars fall along a diagonal: more volume, more range. The bars worth attention are the ones far from it, especially those in the lower right corner, with high effort and a small result.
Step-by-step example
Suppose EURUSD on H1 has been rising for several days and reaches a previous high.
| Step | Calculation | Result |
|---|---|---|
| 1. Tick volume of the bar | From the Volumes indicator | 4,200 |
| 2. Effort | 4,200 ÷ 2,000 (20-bar average) | 2.1 |
| 3. Range of the bar | High − low | 6 pips |
| 4. Result | 6 ÷ 15 (ATR of H1) | 0.4 |
| 5. Location | At a previous high, after a long rally | Resistance |
| 6. Reading | High effort, small result, at resistance | Possible absorption |
Illustrative values. Tick volume depends on the broker, the symbol and the time of day.
The bar is a warning that needs confirmation, which comes from what follows: if the next bars fail to make a new high and price closes below the low of the high-volume bar, the reading gains weight. If price breaks the high with strong volume, the absorption did not hold.
3. Using it with care
Location matters
The same bar means different things in different places. High volume with a small range at resistance after a long rally suggests supply. In the middle of a range, it may mean nothing. At the start of a breakout from a long base, high volume with a large range is what you would expect to see. Reading effort and result without looking at the structure leads to many false readings.
Session and news
Tick volume rises at the London open and during the overlap with New York, so a bar at those hours will often look like high effort. Comparing each bar with the average of the same hour on previous days avoids this. News releases also produce bars with extreme volume and range that are better left out of the reading.
Common mistakes
- Reading volume without price. Volume only makes sense next to the result it produced.
- Using raw values. Compare effort and result with their own averages.
- Ignoring the location. The same bar means different things at support, at resistance or in the middle of a range.
- Treating one bar as a signal. It is a warning that needs confirmation from the following bars.
- Forgetting the session. High volume at the London open is normal.
Conclusions
- Effort and result: volume is the effort and the range is the result. When they agree the bar is easy to read; when they disagree, especially with high volume and a small range, someone may be absorbing the pressure.
- Measuring them in MT5: divide tick volume by its 20-bar average and the range by the ATR. Both values become comparable, and the bars that matter stand out from the rest.
- Using it with care: always read the bar in its location, account for the session and news, and wait for the following bars to confirm what the first one suggests.
Comparing effort and result turns volume from a histogram under the chart into a source of information about who is in control. Test any volume reading with your own data on demo or in the Strategy Tester, and combine it with disciplined risk management.
References
- Anna Coulling, A Complete Guide to Volume Price Analysis, 2013.
- MetaTrader 5 Help: Volumes and Average True Range indicators.
Disclaimer
This content is for informational and educational purposes only. It does not constitute financial advice or a recommendation to buy or sell any instrument. Volume readings describe past activity and are not a forecast. The charts and examples are illustrative, and every asset and every broker is different. Trading forex, CFDs and other leveraged products carries a high risk of loss. Every trading decision, and its outcome, is the sole responsibility of the reader. The author accepts no liability for any loss arising from the use of this information.