
How Mathematics Defines Your Stop Loss and Take Profit

Candle Behavioral Analytics: A Statistical Framework for Measuring Candle Excursions with MFE and MAE in MetaTrader 5
By Eng. Alhassan Ali Mubarak Bahbah
This article examines how historical candle data can be converted into measurable observations of favorable and adverse price movement. It explains what the Candle Behavioral Analytics Expert Advisor calculates, what its statistical ranges mean, and—equally importantly—what those calculations cannot establish.
1. From Personal Estimation to Digital Measurement
Stop-loss and take-profit distances are often selected using fixed numbers, general indicators, chart-based judgment, or personal experience. Those methods may have a place in a trading plan, but they do not directly answer a narrower statistical question: how far did price move favorably and adversely from the opening price of historical candles?
Candle Behavioral Analytics approaches that question through numerical measurement. It separates completed candles into bullish and bearish groups, measures the favorable and adverse excursion within each candle, and summarizes the resulting observations using the arithmetic mean, median, and population standard deviation.
This is not classical chart analysis. The calculations do not identify support or resistance, interpret chart patterns, measure momentum, or independently forecast market direction. They describe the selected historical sample using a defined set of calculations.
The intended application is to provide historical reference values that a trader may evaluate when calibrating stop-loss and take-profit distances. The calculations do not identify an optimal level, and they do not establish that a chosen distance will be safe or reached.
2. What Candle Behavioral Analytics Analyzes
2.1 The role of the Expert Advisor
Candle Behavioral Analytics is an analytical Expert Advisor for MetaTrader 5. It reads historical OHLC data for the chart symbol and a selected target timeframe. It does not open, manage, or close trading positions, and it does not issue an independent buy or sell signal.
Its purpose is to calculate candle-based excursion statistics and display the results in a chart dashboard, together with price projection lines derived from the current target-timeframe candle's opening price.
2.2 Main inputs
- Target timeframe: the timeframe whose historical candles are analyzed. The default setting is Daily.
- Calculation window: a specified number of historical bars or all history currently available to the terminal.
- Measurement unit: automatic selection, Points, or Pips.
- Historical standard-deviation multiplier: scales the standard-deviation figure displayed in the historical statistics.
- Prediction standard-deviation multiplier: controls the width of the calculated statistical reference range.
- Projection display: controls whether bullish and bearish projection lines and their labels are shown.
2.3 Main outputs
- The number of analyzed bars and the separate counts of bullish and bearish candles.
- MFE and MAE statistics for each candle group.
- Median, arithmetic mean, and scaled standard-deviation values.
- The lower and upper boundaries of the calculated MFE and MAE reference ranges.
- Projection lines showing the upper excursion boundaries from the opening price of the current target-timeframe candle.
The bar count represents the number of bars copied for analysis. Doji bars are included in that total but are not included in either directional group.
3. Core Concepts: MFE and MAE
3.1 MFE — Maximum Favorable Excursion
Maximum Favorable Excursion (MFE) is the greatest movement from a candle's opening price in the direction in which that candle ultimately closed.
Bullish candle — favorable movement is upward
MFE bull = (High − Open) / u
Bearish candle — favorable movement is downward
MFE bear = (Open − Low) / u
3.2 MAE — Maximum Adverse Excursion
Maximum Adverse Excursion (MAE) is the greatest movement from a candle's opening price against the direction in which that candle ultimately closed.
Bullish candle — adverse movement is downward
MAE bull = (Open − Low) / u
Bearish candle — adverse movement is upward
MAE bear = (High − Open) / u
Here, u represents the price size of one selected measurement unit. The calculation divides the price difference by that unit, so the resulting MFE and MAE values are expressed in Points or Pips—not in raw quoted-price units.
Important distinction — candle excursion is not a complete trade excursion.
In this Expert Advisor, MFE and MAE are measured from each historical candle's Open, and each candle is assigned to a group only after its Close is known. They are therefore candle-based, retrospective measurements. They are not calculated from a trader's actual entry price, and they do not model a complete trade path.
The abbreviations used here are MFE (Maximum Favorable Excursion) and MAE (Maximum Adverse Excursion). MAF is not the term used by this project.
4. Candle Data and Classification
4.1 OHLC data
- Open: the price at which the candle began.
- High: the highest recorded price during the candle.
- Low: the lowest recorded price during the candle.
- Close: the price at which the candle ended.
4.2 Classification rules
The Expert Advisor classifies each completed candle by comparing its closing price with its opening price:
- Bullish: Close > Open
- Bearish: Close < Open
- Doji: Close = Open
Only completed candles are included. The currently forming candle is excluded from the statistical sample. Doji candles are excluded from both directional groups, so the bullish and bearish counts may sum to less than the total number of analyzed bars.
Retrospective classification matters.
A candle can be labelled bullish or bearish only after it has closed. Consequently, the bullish statistics describe the historical excursions of candles that eventually closed above their opens; the bearish statistics describe candles that eventually closed below their opens. At the opening of a new candle, its eventual classification is not yet known. These groups must not be treated as live signals or as information that was available at the candle's open.
5. Measurement Units: Points and Pips
The Expert Advisor converts price differences into a selected display unit using the current chart symbol's point size and number of decimal digits. A Point is the instrument's quoted minimum price increment exposed by the platform; a Pip is a market convention whose size depends on the instrument and quoting convention.
Measurement settings in the current EA:
| Setting | Current calculation behavior |
|---|---|
| Automatic | For symbols quoted with three or five decimal digits, the EA uses ten Points as one displayed Pip. For other digit counts, it uses Points. |
| Points | One unit is the symbol's Point size. |
| Pips | For three- and five-digit symbols, one unit is ten Points. For other digit counts, the current code uses one Point while retaining the “Pips” label. That may coincide with a conventional Pip on some two- or four-digit FX quotes, but it is not a universal Pip definition for every instrument. |
Unit-setting limitation in the current EA version.
The code infers the Pips conversion from the number of decimal digits; it does not verify the instrument class or the broker's Pip convention. On conventional two- or four-digit FX quotes, one Point may equal one Pip. On gold, indices, and other non-FX instruments, the displayed “Pips” label may not represent a universally defined Pip. Verify the symbol's actual convention and prefer Automatic or Points when a Pip definition is ambiguous.
Unit consistency is essential. A distance calculated in Points must be interpreted as Points, and a distance calculated in Pips must be converted using the correct price size before it is added to or subtracted from an entry price.
6. Statistical Measures
6.1 Arithmetic Mean
The arithmetic mean is the sum of all observations divided by the number of observations.
μ = (x₁ + x₂ + ⋯ + xₙ) / n = (Σxᵢ) / n
The mean is the central value used in the EA's reference-range calculation. It describes the average observed excursion, but it can be pulled upward by a small number of unusually large observations.
6.2 Median
The median is the middle observation after the values have been sorted. With an even number of observations, it is the arithmetic mean of the two central values.
Odd n: Median = the middle sorted observation
Even n: Median = (the two middle observations) / 2
The median is less sensitive to extreme observations than the arithmetic mean. A noticeable difference between the mean and median can indicate that a relatively small number of candles have unusually large excursions.
6.3 Population Standard Deviation
Population standard deviation measures the dispersion of the observations around their mean. The implementation divides by the number of observations, n, rather than n − 1.
σ = √[ Σ(xᵢ − μ)² / n ]
- A smaller standard deviation indicates that the observations are more concentrated around the mean.
- A larger standard deviation indicates greater variation between candles.
- Standard deviation measures dispersion; it does not indicate whether the market will move up or down.
Implementation detail: the historical dashboard displays the raw population standard deviation multiplied by the historical SD multiplier. If that multiplier is 1.00, the displayed value equals the raw standard deviation. If it is not 1.00, the displayed figure is scaled and should not be described as the unadjusted standard deviation.
7. Building the Statistical Reference Range
7.1 Calculation
The EA builds a range around the historical mean by adding and subtracting the raw population standard deviation multiplied by a user-selected factor k. Because MFE and MAE are non-negative distances, the lower boundary is limited to zero.
Lower and upper boundaries:
Lower = max(0, μ − kσ)
Upper = μ + kσ
The range is therefore a mean-centred dispersion band, clipped at zero where necessary. In the dashboard, the standalone value shown before the bracket is the upper boundary (μ + kσ); it is not a second mean or an independently estimated expected value.
7.2 Two different standard-deviation multipliers
- The historical SD multiplier scales the SD figure displayed beside the historical mean and median.
- The prediction SD multiplier determines the width of the reference range around the mean.
- The reference-range calculation uses the raw population standard deviation, not the already scaled historical display figure.
The multipliers should be non-negative. The current EA code does not enforce a non-negative input, so a negative setting can produce an inverted or misleading range. Use zero or positive values until input validation is added.
7.3 Theoretical normal-distribution coverage
The following percentages are familiar theoretical central coverage values for a symmetric, untruncated normal distribution:
Theoretical central coverage under a normal distribution:
| Central interval | Theoretical coverage under normality |
|---|---|
| ±0.5σ | 38.29% |
| ±1σ | 68.27% |
| ±1.5σ | 86.64% |
| ±2σ | 95.45% |
| ±2.5σ | 98.76% |
| ±3σ | 99.73% |
IMPORTANT STATISTICAL WARNING
These percentages are theoretical values only; they are not measured hit probabilities produced by the EA.
The table assumes a normal distribution and a symmetric interval around the mean. The EA does not test whether the market-excursion data are normally distributed, and it clips a negative lower boundary to zero. Market excursions may be skewed, heavy-tailed, dependent, and time-varying. Therefore, the theoretical percentages must not be presented as guaranteed coverage, a formal confidence interval, or the probability that a future candle will remain inside the displayed range.
7.4 Practical interpretation
A trader may treat the calculated lower and upper boundaries as candidate distances for further evaluation. Choosing a value inside the band does not make that value optimal, safe, or statistically guaranteed. The choice still depends on the trading method, actual entry location, account risk, execution costs, and out-of-sample testing.
8. Using MAE for Stop-Loss Calibration
8.1 Sell trade
For a sell trade, an adverse move is upward. The corresponding historical candle group in this framework is the bearish group, and the relevant reference statistic is bearish MAE.
Sell Stop Loss = Entry Price + (Selected Bearish MAE × u)
The multiplication by u converts the selected distance from Points or Pips back into quoted-price units before it is added to the entry price.
8.2 Buy trade
For a buy trade, an adverse move is downward. The corresponding historical candle group is the bullish group, and the relevant reference statistic is bullish MAE.
Buy Stop Loss = Entry Price − (Selected Bullish MAE × u)
The selected distance may be compared with the historical median, mean, and calculated reference range. It must then be assessed against the position size and the maximum monetary loss permitted by the trading plan.
8.3 What the MAE range can and cannot do
The MAE range can provide historical context for the size of adverse candle movement. It does not establish a safe stop distance. A future candle can exceed the historical upper boundary, and the statistics are not specific to a trade entered at an arbitrary time or price.
Spread, commission, slippage, liquidity, and any required execution buffer must be considered separately. They are not automatically added to the excursion values calculated by the EA.
9. Using MFE for Take-Profit Calibration
9.1 Buy trade
For a buy trade, favorable movement is upward. The corresponding historical candle group is the bullish group, and the relevant reference statistic is bullish MFE.
Buy Take Profit = Entry Price + (Selected Bullish MFE × u)
9.2 Sell trade
For a sell trade, favorable movement is downward. The corresponding historical candle group is the bearish group, and the relevant reference statistic is bearish MFE.
Sell Take Profit = Entry Price − (Selected Bearish MFE × u)
9.3 Practical interpretation
The lower part of the range may be examined as a more conservative candidate distance, the mean as a central historical reference, and the upper part as a more ambitious candidate. These descriptions are comparative only; they do not establish the probability of reaching a target.
A target beyond the historical upper boundary is not mathematically impossible. It simply lies outside the selected reference band and requires separate justification and testing.
10. Combining MAE and MFE
MAE and MFE can be considered together when comparing a candidate stop distance with a candidate target distance. Both distances must use the same measurement unit.
Reward-to-risk distance ratio:
Reward-to-Risk = Selected MFE / Selected MAE
The reciprocal expression is the risk-to-reward distance ratio: selected MAE divided by selected MFE. Stating the order explicitly avoids ambiguity in the phrase “risk/reward ratio”.
- A larger selected MAE relative to selected MFE produces a less favorable distance relationship.
- A larger selected MFE relative to selected MAE produces a more favorable nominal distance relationship.
- The ratio is undefined when the selected MAE is zero.
A distance ratio is not an expectancy calculation.
The ratio does not include the probability of reaching the target, the probability of hitting the stop first, the frequency of trades, or transaction costs. The EA measures each candle's high and low but does not reconstruct the order in which those prices occurred. If both a stop and target lie within the same candle's high-low range, OHLC data alone cannot establish which level was reached first.
11. Reading the GBPJPY Example
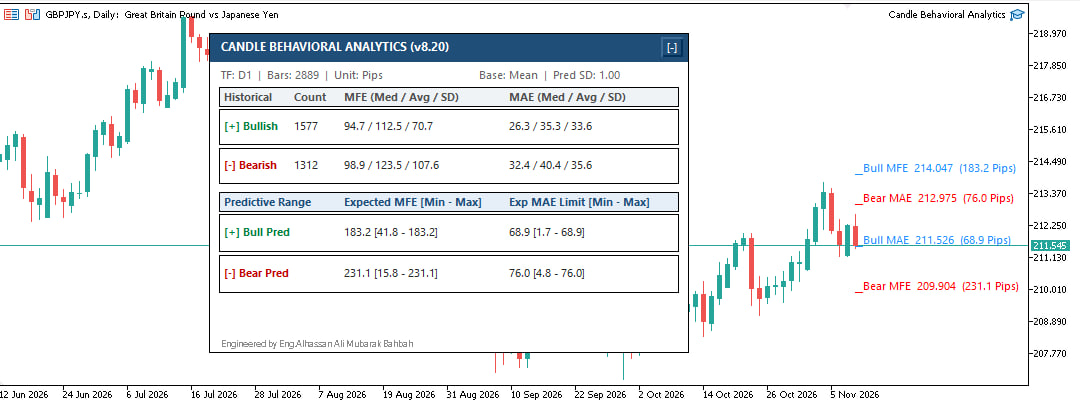
Figure 1. Candle Behavioral Analytics — GBPJPY, Daily timeframe.
The supplied example describes a Daily analysis of 2,889 bars, using Pips as the displayed unit. It reports 1,577 bullish candles and 1,312 bearish candles. The historical columns are presented in the order Median / Mean / Standard Deviation.
| Direction | MFE: Median / Mean / SD | MAE: Median / Mean / SD | Calculated MFE range | Calculated MAE range |
|---|---|---|---|---|
| Bullish (1,577 candles) | 94.7 / 112.5 / 70.7 pips | 26.3 / 35.3 / 33.6 pips | 41.8 – 183.2 pips | 1.7 – 68.9 pips |
| Bearish (1,312 candles) | 98.9 / 123.5 / 107.6 pips | 32.4 / 40.4 / 35.6 pips | 15.8 – 231.1 pips | 4.8 – 76.0 pips |
The listed boundaries are numerically consistent with a mean ± one raw standard deviation, with the lower endpoint limited to zero, when the prediction multiplier is 1.00. Because the historical SD displayed in the dashboard can be scaled independently, confirm that the historical SD multiplier is also 1.00 before treating the table's SD column as the raw standard deviation. The exact values should be checked against the final MetaTrader 5 screenshot and the broker's GBPJPY price history before publication.
11.1 Interpreting the bullish row
The bullish row summarizes candles that closed above their opening prices. In the proposed buy-side application, its MAE statistics are examined as historical context for adverse movement, while its MFE statistics are examined as historical context for favorable movement. The row does not imply that a future candle will be bullish.
11.2 Interpreting the bearish row
The bearish row summarizes candles that closed below their opening prices. In the proposed sell-side application, its MAE statistics are examined as historical context for adverse movement, while its MFE statistics are examined as historical context for favorable movement. The row does not imply that a future candle will be bearish.
The dashboard displays numerical ranges. The chart projection lines, however, are drawn at the upper MFE and MAE boundaries from the opening price of the current target-timeframe candle; the lines do not draw both edges of each statistical range. The dashboard's bracketed values provide the lower and upper boundaries.
12. Buy and Sell Applications
12.1 Buy-side workflow
- Review the historical bullish MAE distribution as a reference for adverse candle movement.
- Review bullish MFE as a reference for favorable candle movement.
- Select candidate stop and target distances in a consistent unit.
- Convert each selected distance into quoted-price units before calculating the stop-loss and take-profit prices.
- Check the monetary risk, position size, execution costs, and strategy-specific entry conditions.
- Test the complete trade rule on data that was not used to calculate the reference statistics.
Buy Stop Loss = Entry − (Bullish MAE × u)
Buy Take Profit = Entry + (Bullish MFE × u)
12.2 Sell-side workflow
- Review the historical bearish MAE distribution as a reference for adverse candle movement.
- Review bearish MFE as a reference for favorable candle movement.
- Select candidate stop and target distances in a consistent unit.
- Convert each selected distance into quoted-price units before calculating the stop-loss and take-profit prices.
- Check the monetary risk, position size, execution costs, and strategy-specific entry conditions.
- Test the complete trade rule on data that was not used to calculate the reference statistics.
Sell Stop Loss = Entry + (Bearish MAE × u)
Sell Take Profit = Entry − (Bearish MFE × u)
Reference mapping:
- Buy: Examine bullish candles; use bullish MAE as the stop-loss reference and bullish MFE as the take-profit reference.
- Sell: Examine bearish candles; use bearish MAE as the stop-loss reference and bearish MFE as the take-profit reference.
This mapping reproduces the project's proposed analytical framework. Because the candle group is determined retrospectively by the candle's close, the mapping is a historical comparison—not a real-time classification rule for a new candle.
13. Additional Applications
13.1 Stop-loss calibration
Compare the median, mean, and MAE reference range to examine candidate stop distances. The final distance must also satisfy the account's monetary risk limit and the trading method's rules.
13.2 Take-profit calibration
Compare the MFE median, mean, and reference range when examining candidate target distances. A historical excursion range is a descriptive reference, not evidence that a target will be reached.
13.3 Symbol comparison
Compare the scale and dispersion of MFE and MAE across symbols, recalculating each symbol independently. The values should not be transferred directly between instruments with different price scales, volatility characteristics, or trading conditions.
13.4 Timeframe comparison
Study how the same symbol's candle excursions differ across timeframes. A Daily statistic should not be copied into an hourly method without recalculating and testing it on the relevant timeframe.
13.5 Scenario analysis
Compare conservative, central, and expanded candidate distances, then evaluate their effect on a complete strategy's historical outcomes. This analysis should include the sequence of stop and target events and realistic trading costs.
14. Validation and Testing
14.1 Separate estimation from evaluation
Use an earlier historical period to calculate the reference statistics, then evaluate the chosen distances on a later, unseen period. Measuring performance on the same observations used to build the range does not establish out-of-sample usefulness.
14.2 Measures worth evaluating
- The empirical percentage of test-period excursions falling inside the selected range.
- The average and distribution of excursions beyond the range.
- The percentage of trades in which the stop is reached.
- The percentage of trades in which the target is reached.
- Which level is reached first when both stop and target are touched within one candle.
- Net results after spread, commission, slippage, and other relevant costs.
- Stability across different historical periods and market conditions.
Because OHLC data does not reveal the full intrabar sequence, a realistic stop-first or target-first test may require lower-timeframe or tick data. The validation method must not silently assume the favorable order when both levels lie inside the same candle.
The purpose of testing is to measure robustness and identify failure conditions—not to turn historical statistics into certainty.
15. Scientific and Practical Limitations
- The calculations use OHLC candle data and do not reconstruct the complete intrabar price sequence.
- MFE and MAE are measured from candle Open, not from an actual trade entry price.
- Bullish and bearish groups are defined using the completed candle's Close, so their classification is retrospective.
- The EA does not model a complete trading strategy or determine which of a stop and target would be reached first.
- Spread, commission, slippage, liquidity, and execution effects are not automatically included in the excursion values.
- The EA does not automatically create a training and testing split.
- All selected historical observations are treated equally; the calculation does not apply recency weighting or a market-regime model.
- Outliers can materially affect the arithmetic mean and standard deviation.
- Doji candles are excluded from the bullish and bearish groups.
- The code does not enforce a minimum sample size or validate that standard-deviation multipliers are non-negative.
- The Pips conversion is inferred from decimal digits rather than verified against the instrument class or broker-specific Pip convention; this can make the Pips label ambiguous on non-FX symbols.
- The reference range is descriptive and statistical; it is not a guaranteed forecast or a formal prediction interval.
- Results depend on the symbol, timeframe, broker history, sample window, unit convention, and selected parameters.
16. Conclusion
Candle Behavioral Analytics converts historical candle ranges into numerical observations. Candle-based MFE describes movement in the eventual closing direction, while candle-based MAE describes movement against it. The arithmetic mean summarizes the average, the median provides a less outlier-sensitive central measure, and population standard deviation describes dispersion.
The resulting range can serve as a statistical reference when examining candidate stop-loss and take-profit distances. Its usefulness must be established through out-of-sample testing of a complete trading method, with realistic execution costs and the order of intrabar events taken into account.
The central idea is simple: measure the selected historical data, understand exactly what the measurements represent, and test any trading application independently. Statistics can improve the discipline of measurement; they do not remove market uncertainty.
17. Disclaimer
DISCLAIMER
This article and the associated Candle Behavioral Analytics Expert Advisor provide historical candle measurements and statistical analysis for educational and research purposes only. They do not constitute financial advice, investment advice, a recommendation to buy or sell any financial instrument, or an independent trading signal.
Historical MFE, MAE, averages, standard deviations, and calculated reference ranges do not guarantee future market behavior, the safety of a stop-loss level, or the achievement of a take-profit target. The calculations do not model every execution condition or the complete sequence of prices inside a candle.
Trading financial markets involves substantial risk and may result in the loss of capital. Each user is solely responsible for independently validating the methodology, verifying symbol-specific units, considering spread, commission, slippage and liquidity, determining appropriate position size, and making all trading decisions. Past observations are not a promise or guarantee of future results.
Candle Behavioral Analytics
Developed by Eng. Alhassan Ali Mubarak Bahbah
#Risk Management, metatrader, stop loss, Statistical Analysis, take profit, Candle Analysis, MFE, MAE