Not Every Zone Is Equal: Meet Zone DNA PRO
If you trade supply and demand, you know the problem. Open any chart and you’ll find zones everywhere. Some hold beautifully. Others break the moment price touches them. From the outside they look the same: a rectangle on the chart.
So we asked a simple question: what if every zone had DNA, a set of traits you could read before price ever gets there?
That’s the idea behind Zone DNA PRO.
Six genes, one grade
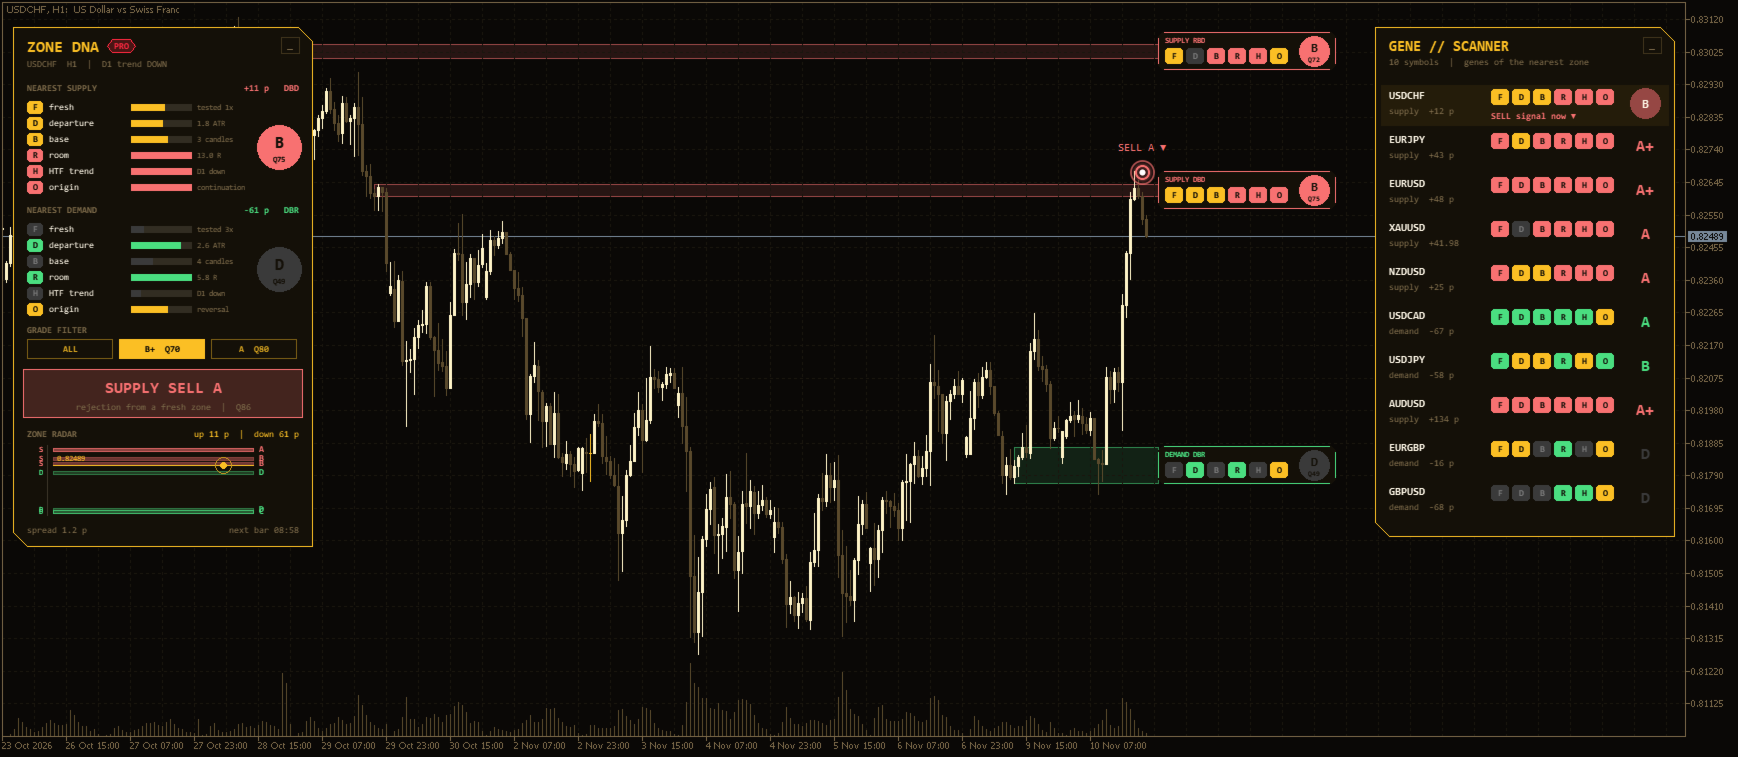
Zone DNA PRO doesn’t just draw zones. It reads six “genes” of each one:
- F – Fresh: has price already been back to this zone? Untouched zones tend to carry more weight.
- D – Departure: how strongly did price leave? A slow drift and an explosive move tell very different stories.
- B – Base: how tight was the base before the move? Clean, compact bases make clearer zones.
- R – Room: how much space is there before the next opposite zone? A zone with no room to run is a zone with limited potential.
- H – HTF trend: does the higher timeframe agree with the zone’s direction?
- O – Origin: is it a reversal (DBR / RBD) or a continuation (RBR / DBD)?
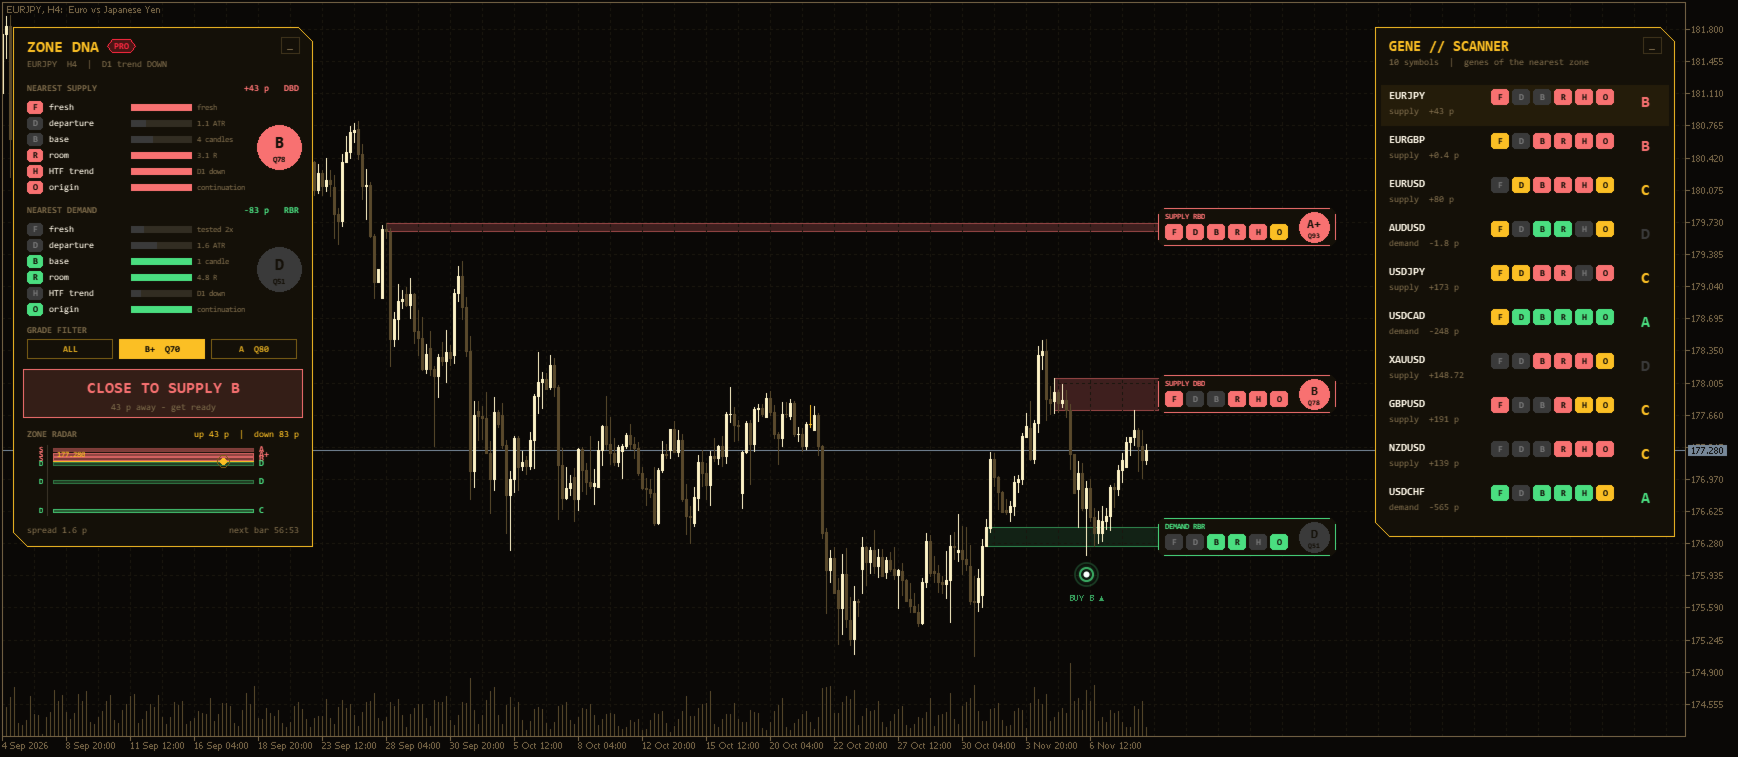
Each gene is scored, and together they give the zone a grade from A+ to D. Instead of guessing which rectangle matters, you see it at a glance.
Signals only when price proves it
A zone is a place to watch, not a reason to enter. Zone DNA PRO waits for price to come into the zone and for a candle to reject it. Only then does it print a BUY or SELL signal, with the grade, entry, stop loss and three take-profit levels.
Signals appear only after the candle closes, and they never repaint. What you see on the chart is what the indicator saw at that moment.
You choose how picky to be
One click on the dashboard switches the grade filter between ALL, B+ and A. Want to see every zone the market built? Choose ALL. Want only the strongest ones? Choose A, and the chart quiets down to what matters most.
A dashboard that tells you where you are
The dashboard shows:
- the nearest supply and demand zones, with their gene bars and grade
- a live status: watching, close to a zone, or in a zone
- a zone radar showing how far price is from each level
You always know whether it’s time to wait or time to pay attention.
The gene scanner: up to 16 symbols at once
Most traders miss good zones simply because they’re on the wrong chart. The gene scanner watches up to 16 symbols and shows the genes and grade of each symbol’s nearest zone. Click any row and that chart opens instantly.
Alerts, so you don’t have to stare
Zone DNA PRO can alert you (popup, sound or push to your phone) when:
- a new signal appears
- price enters a fresh zone
- a scanner symbol gets a new signal
Built to stay clean
A matching chart theme gives the whole screen one calm look, and your own colours come back when you remove it. Past signals can be shown or hidden, so your chart only shows what you want to see.
The bottom line
Zone DNA PRO doesn’t promise to predict the market. Nothing can. What it does is give every supply and demand zone a clear, readable profile, so your decisions start from information instead of guesswork.
Every zone has DNA. Now you can read it.
https://www.mql5.com/en/market/product/207576