
JET Market Monitor US30 Free and PRO: the 30 US30 stocks in one heat map on your MetaTrader 5 chart

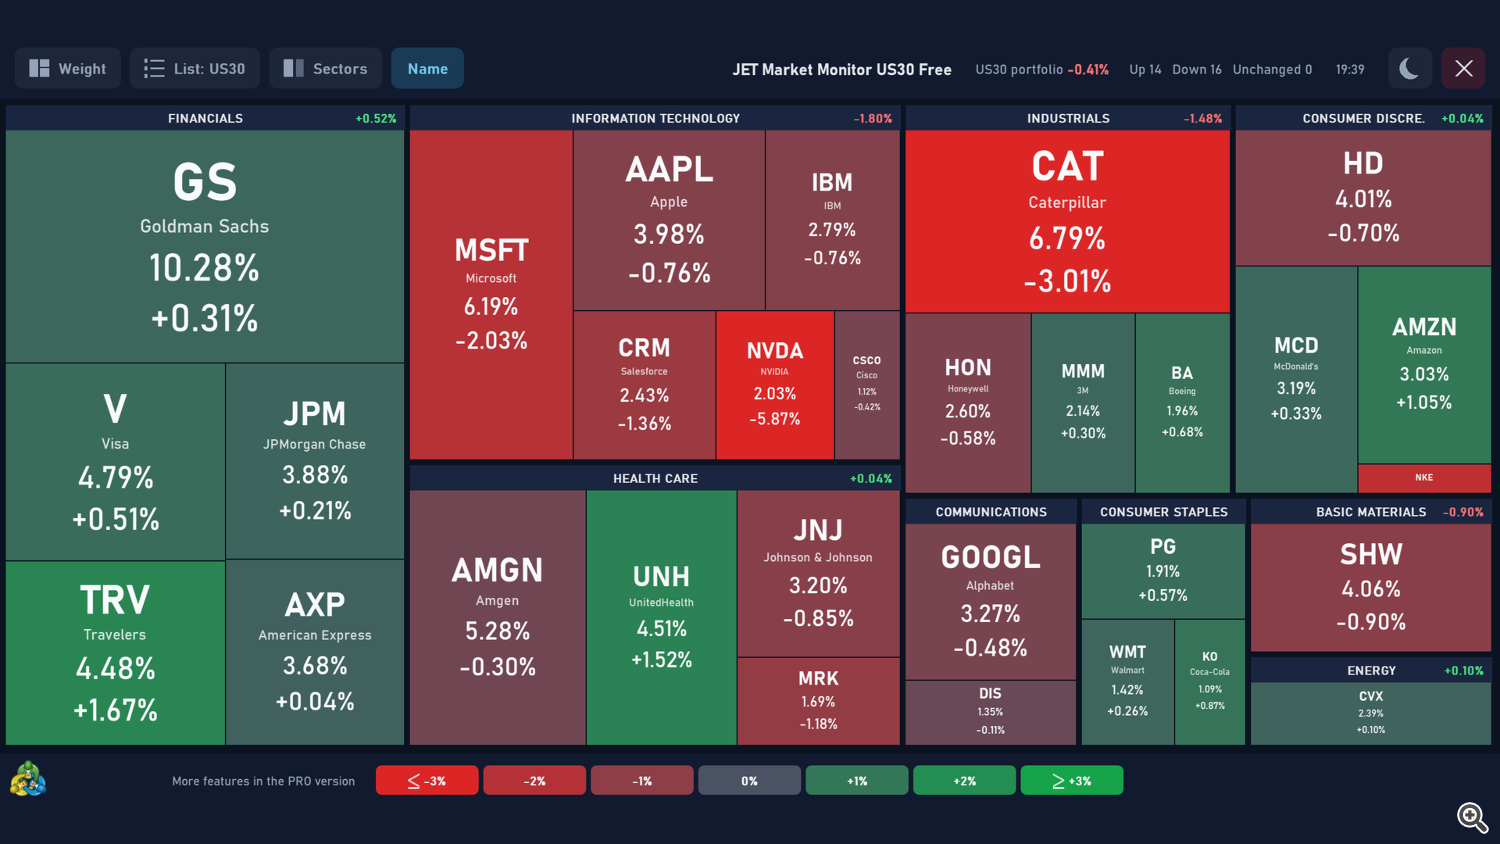
JET Market Monitor US30 is a new indicator for MetaTrader 5 that shows the 30 stocks that make up the Dow Jones Industrial Average in one panel, right on your chart. It comes in two editions: Free, a heat map of the 30 stocks by weight and sector, and PRO, which adds more ways to organize the map, a list mode, a details box, price lines and your own lists.
Both are indicators only: they never open, close or change orders.
What it shows
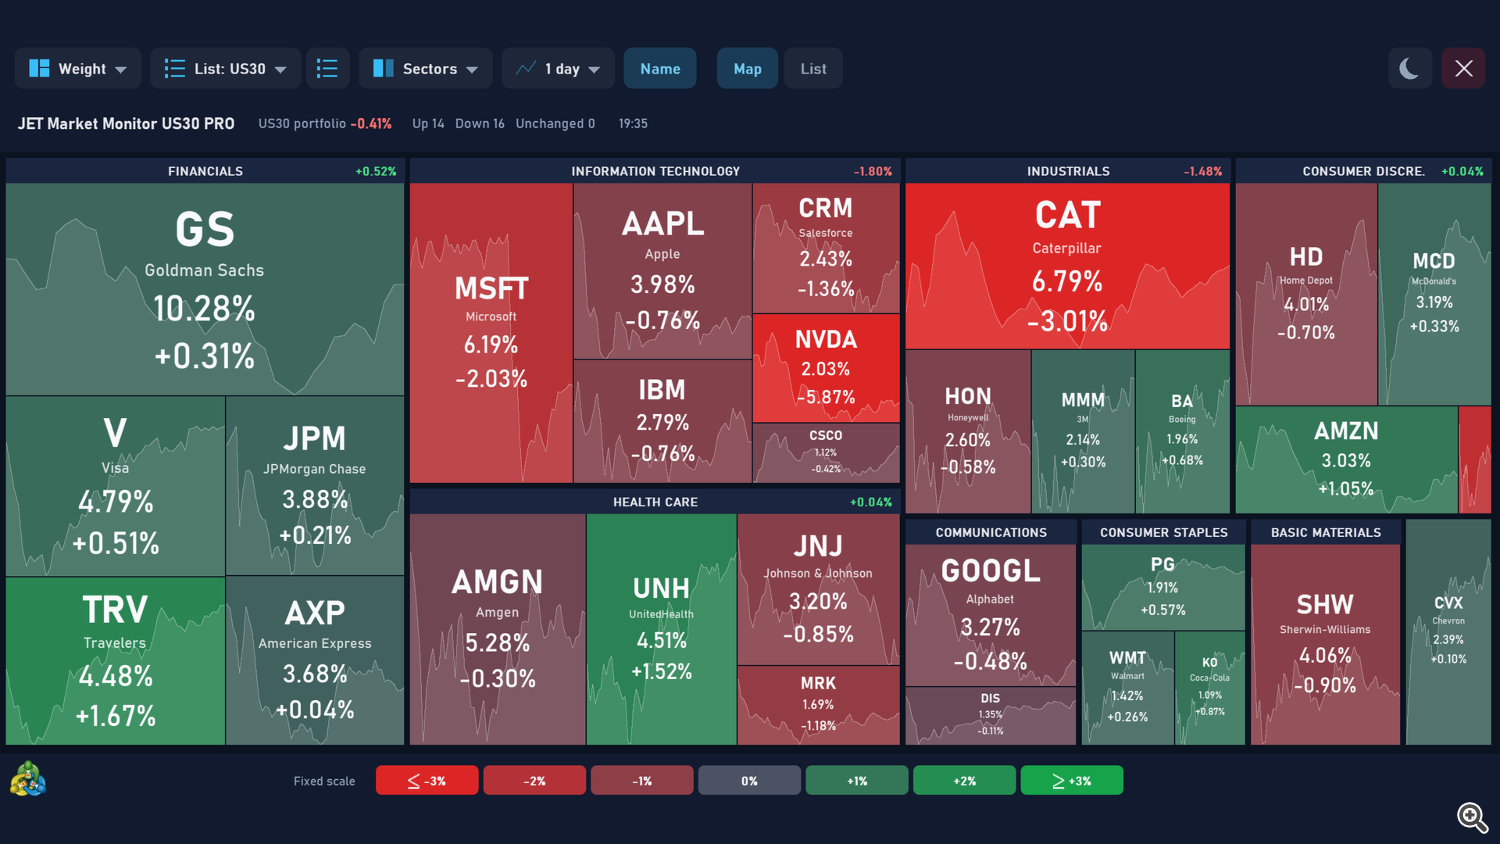
Each box of the heat map is a stock. Its size follows the stock's weight in the index and its color follows the daily change: green up, red down, gray at 0.00%. The stocks are grouped by sector, so you can see at a glance which sectors are leading and which are lagging.
- In each box: symbol, company name (can be turned off), weight and change; smaller boxes show fewer lines.
- Top bar: weighted change of the US30 portfolio, number of stocks up, down and unchanged, and session status.
- Color scale with a legend at the bottom.
- Dark and light themes, 11 languages (automatic from the terminal), adjustable panel size.
- X button: removes the indicator and restores the chart.
Free or PRO?
| Free | PRO | |
|---|---|---|
| Stocks | the 30 US30 stocks | the 30 US30 stocks + your own lists |
| Organize by (box size) | Weight | Weight, Turnover (when the broker provides it), Daily, Weekly, Monthly or Yearly change |
| Group | by sector | by sector or by change |
| Price line in each box | — | 1 day to 1 year, or this year |
| List mode with sortable columns | — | yes |
| Details box and click to open the chart | — | yes |
| Your own lists | — | up to 30 lists of up to 200 symbols |
| Color scale | fixed (±3%) | fixed or automatic |
| Themes, 11 languages, panel size | yes | yes |
| Refresh | every 2 seconds | from 200 ms |
What PRO adds
- Organize by weight, turnover (when the broker provides it) or daily, weekly, monthly or yearly change.
- Group by change: POSITIVE and NEGATIVE blocks, besides the sectors.
- Price line in the background of each box: 1 day, 2 days, 1 week, 1 month, 3 months, 6 months, 1 year or this year.
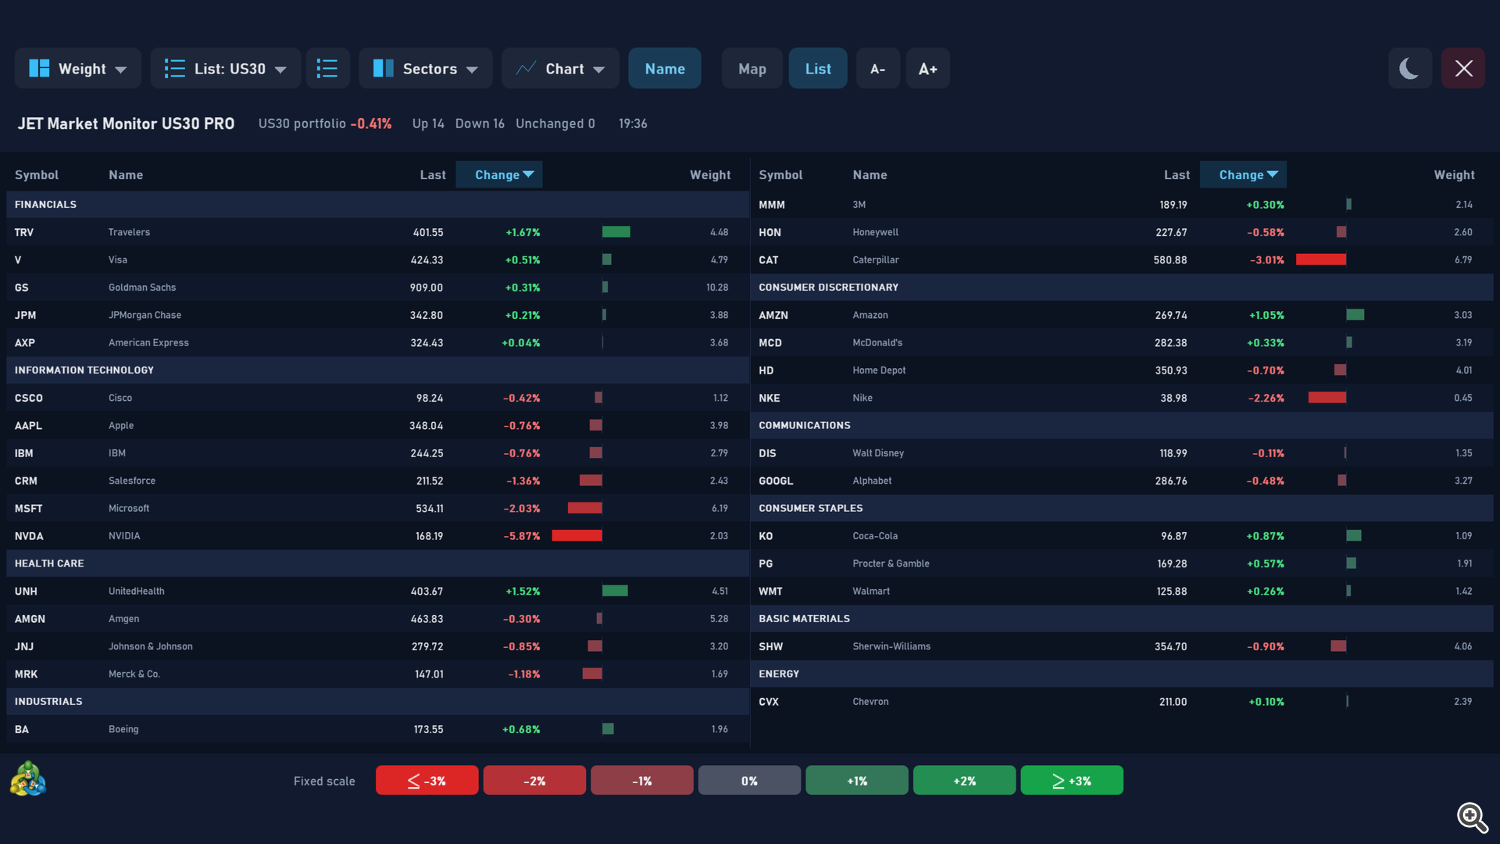
- List mode: Symbol, Name, Sector, Last, Change, Turnover and Weight columns; click a header to sort; A−/A+ adjust the text size.
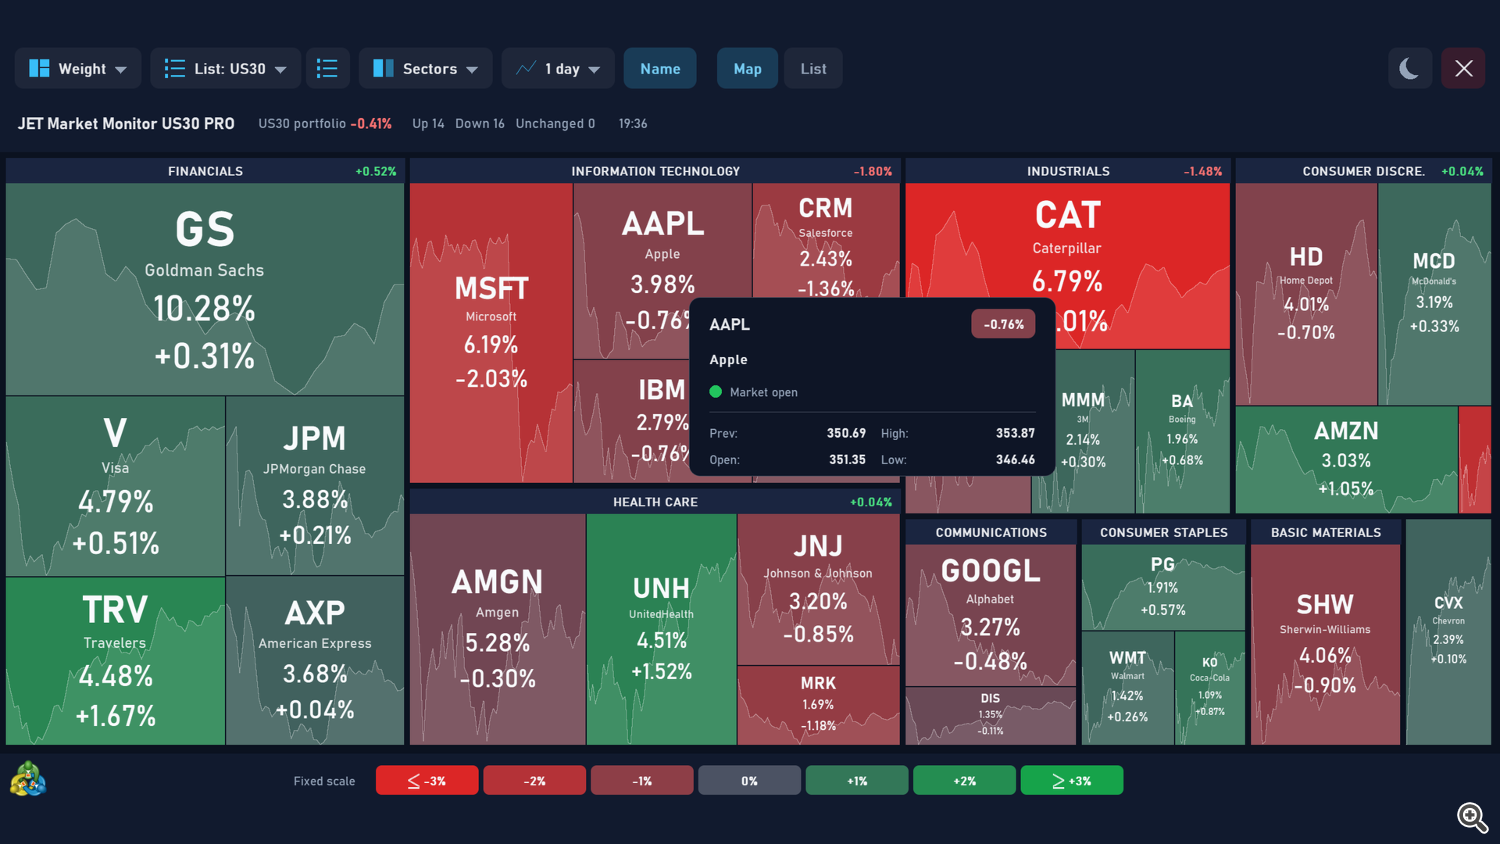
- Details box: rest the mouse on a stock to see the daily change, full name, "Market open" or "Market closed", previous close, open, high and low. A click opens the stock's chart.
- Your own lists with any symbol from your broker; the built-in editor searches symbols as you type.
- Automatic color scale, adapting to the size of the day's moves.
Works on most brokers
- Requires a broker that offers US stocks or stock CFDs in MetaTrader 5.
- The indicator finds the stocks automatically on most brokers. If one is not found, enter its name in the Symbol names input, in the format TICKER=SYMBOL; ...
- Prices, turnover and any quote delay depend on your broker's data feed.
- If the account has no US stocks, the indicator opens normally and shows a notice.
Download
- JET Market Monitor US30 Free — heat map of the 30 stocks by weight and sector.
- JET Market Monitor US30 PRO — all the features above.
Questions and suggestions: send me a private message through my MQL5 profile.
JET Market Monitor US30 is not affiliated with, sponsored or endorsed by S&P Dow Jones Indices. The name Dow Jones Industrial Average is used only to describe the stocks displayed.
Trading involves risk of loss. The indicator displays market data; it does not predict prices and does not guarantee results.