How to Turn Any Arrow Indicator into an Expert Advisor in 5 Minutes (Fractals Example)

Many traders have an indicator that draws BUY and SELL arrows and want an Expert Advisor to trade those arrows. Before any EA can do that, four questions have to be answered — and the answers are not visible on the chart. This post walks through them on Fractals, the indicator that ships with every MetaTrader 5 terminal, so you can repeat every step yourself.
How an arrow indicator talks to an Expert Advisor
An EA never sees the arrows you see. It reads numbers from the indicator's buffers — arrays with one value per bar — through iCustom() and CopyBuffer(). For an arrow indicator this means:
- Which buffer is BUY and which is SELL. An indicator can have several buffers; their order is decided by the author, not by the colour of the arrow.
- What "no signal" looks like. On bars without an arrow the buffer holds an empty value. Usually it is EMPTY_VALUE (DBL_MAX), but some indicators use 0 or a constant such as −1. If the EA compares against the wrong value, it sees a signal on every bar.
- On which bar a new arrow appears. Bar 0 is the bar that is still forming, bar 1 is the last closed bar. Many indicators can only confirm a signal a few bars later and draw it back in the past. An EA that reads bar 1 for such an indicator will never see an arrow.
- Whether the arrows stay where they were drawn. If an indicator moves or deletes arrows on closed bars ("repaints"), the history on the chart looks better than what an EA could have traded live.
With those four facts, reading the signal is a few lines of MQL5:
// once in OnInit()
int h = iCustom(_Symbol, _Period, "Examples\\Fractals");

// once per new bar
double up[1], dn[1];
int shift = 3;                                   // the bar where new arrows appear
if(CopyBuffer(h, 0, shift, 1, up) == 1 && CopyBuffer(h, 1, shift, 1, dn) == 1)
  {
   bool sell = (up[0] != EMPTY_VALUE && up[0] != 0.0);   // buffer 0: upper fractal
   bool buy  = (dn[0] != EMPTY_VALUE && dn[0] != 0.0);   // buffer 1: lower fractal
  }
The hard part is not the code — it is finding the right numbers for an indicator you did not write, often one you only have as an EX5 file. Below they are measured instead of guessed.
Step 1. Find the buffers
Open an EURUSD H1 chart, add Examples\Fractals from the Navigator, then add the free Signal Buffer Inspector to the same chart (Target selection: Auto). It reads every buffer of the target indicator and classifies it.
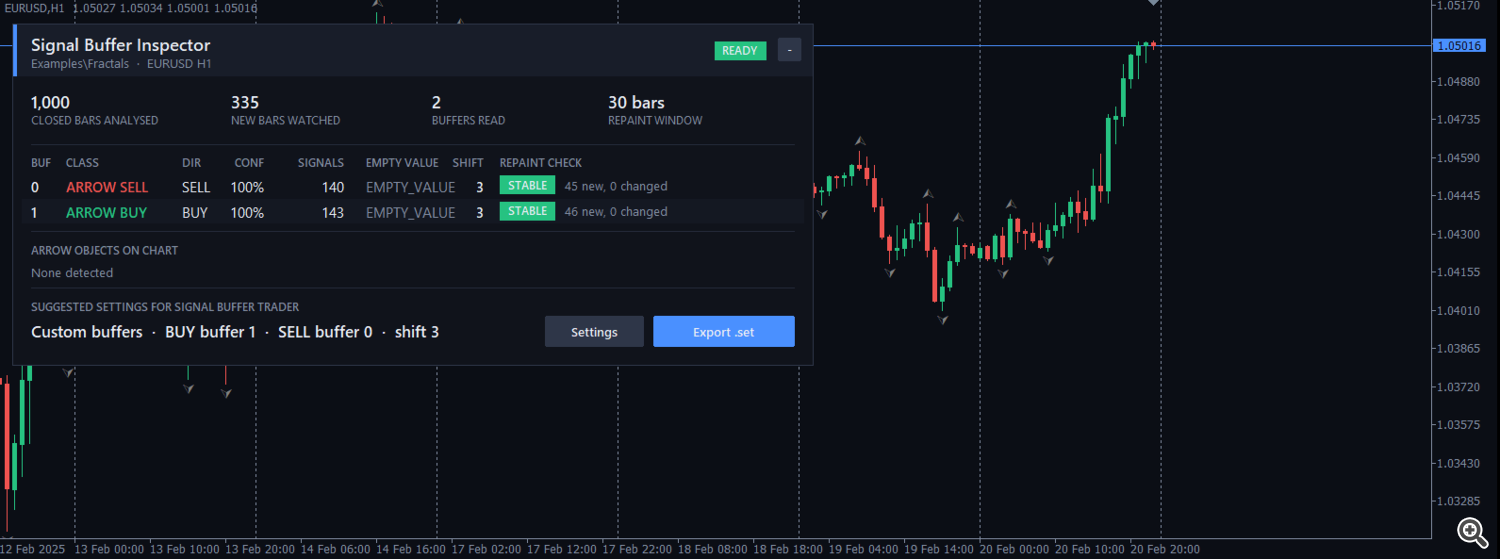
For Fractals the table says:
- buffer 0 — ARROW SELL, direction confidence 100 %;
- buffer 1 — ARROW BUY, direction confidence 100 %;
- empty value — EMPTY_VALUE in both buffers;
- shift — 3: new fractal arrows appear on bar 3, never on bar 1, because a fractal needs bars to its right before it can be drawn.
The shift is measured on new bars, not read from history. On a live chart the inspector needs some new bars before it can report it; the quick way is to run it in the Strategy Tester in visual mode, where hundreds of bars pass in a few minutes.
Step 2. Check for repainting
While new bars arrive, the inspector records the values of closed bars and compares them later. Fractals passed: in 1 500 new bars, 0 values changed on closed bars (status STABLE).
For contrast, here is Examples\ZigZag on the same chart:
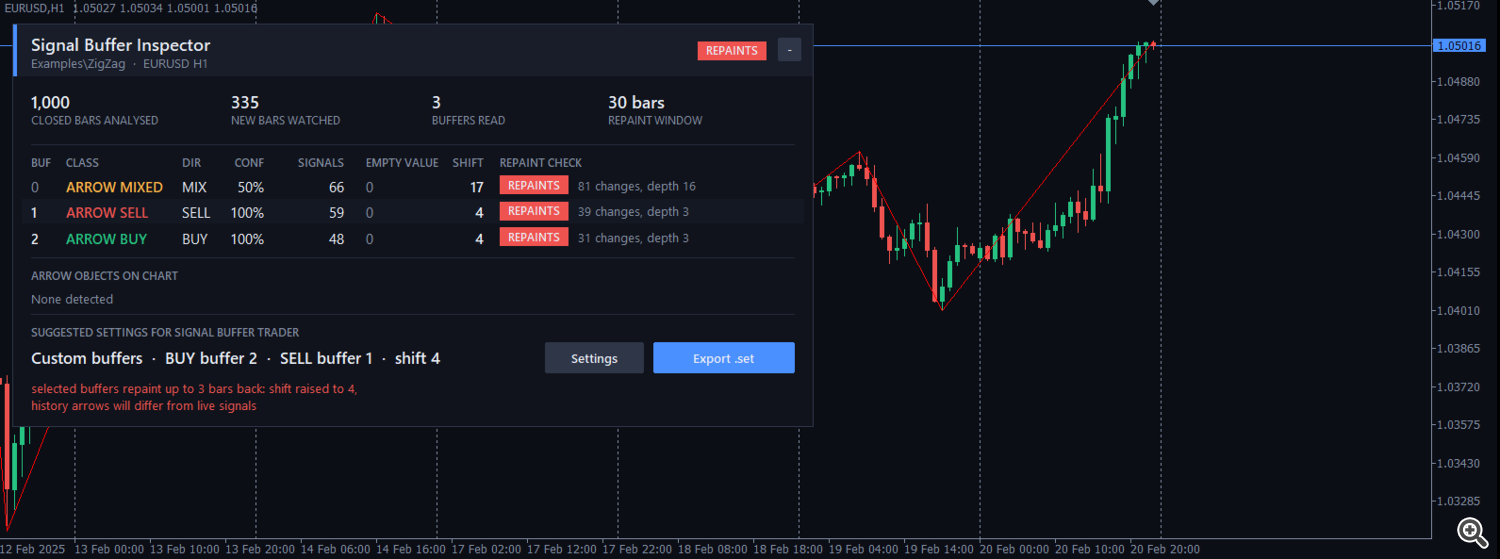
Every buffer is flagged REPAINTS — 81 changes up to 16 bars back in buffer 0. ZigZag is a useful indicator for reading structure, but its latest point keeps moving until the swing is confirmed. An EA that trades its arrows sees a different picture in real time than the one you see on history. The inspector raises the suggested shift and prints a warning instead of hiding it.
Step 3. Export the settings
Press Export .set. The inspector writes the result to the terminal's common folder Files\SignalBufferInspector\SBT_Fractals_EURUSD_H1.set:
; Target: Examples\Fractals on EURUSD H1
; BUY buffer 1 (STABLE (210 new, 0 changed)), SELL buffer 0 (STABLE (201 new, 0 changed)), shift 3, 1500 new bars observed
InpSignalSource=1
InpSignalShift=3
InpInd1Path=Examples\Fractals
InpInd1Params=
InpInd1BuyBuffer=1
InpInd1SellBuffer=0
It is a normal MetaTrader settings file: the comments document what was measured, and the values can be loaded into an EA.
Step 4. Load it into the Expert Advisor
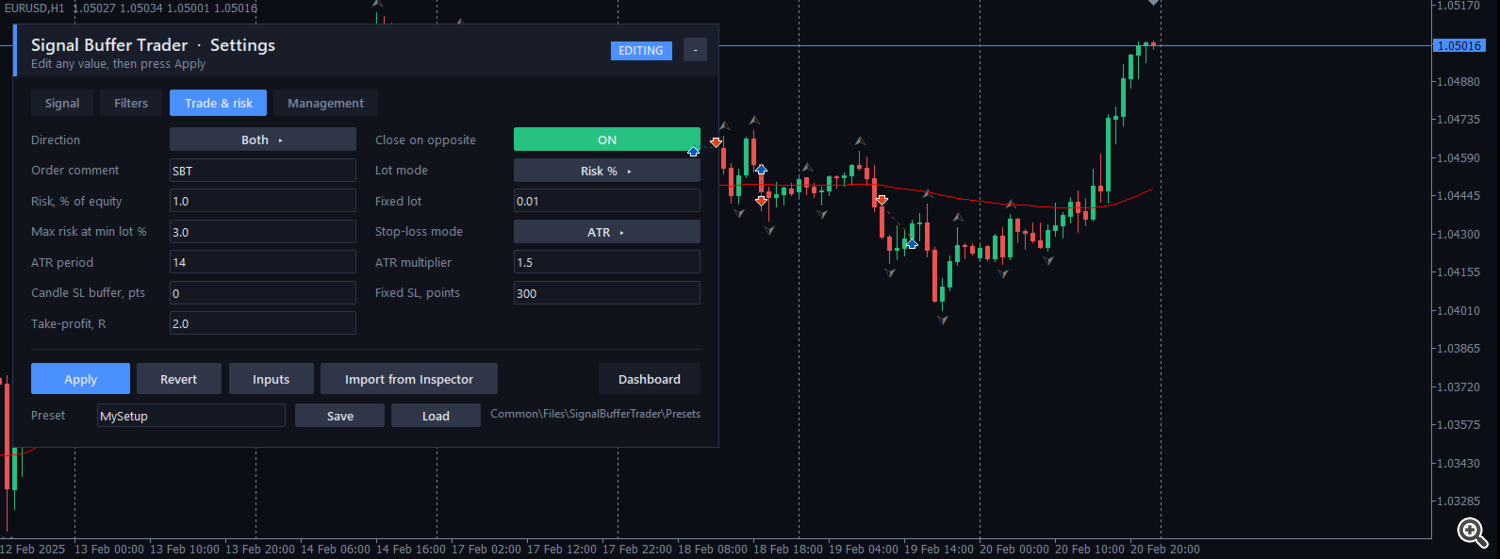
The file is made for Signal Buffer Trader, an Expert Advisor that trades buffer signals with a stop-loss on every order. On the chart, press Edit settings → Import from Inspector, review the values and press Apply. In the Strategy Tester, use Load on the Inputs tab and pick the same file.
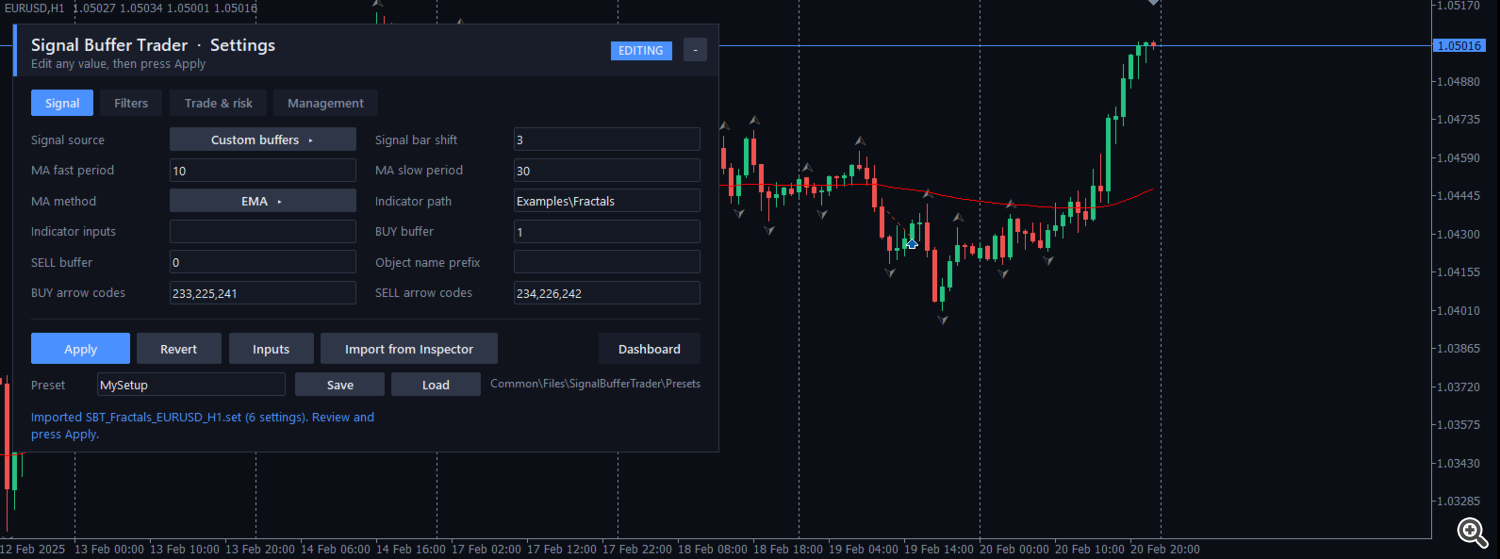
Then choose how the trade is protected — every order gets a stop-loss (ATR, signal candle or fixed points), and the lot follows the risk per trade.
Step 5. Run it in the Strategy Tester
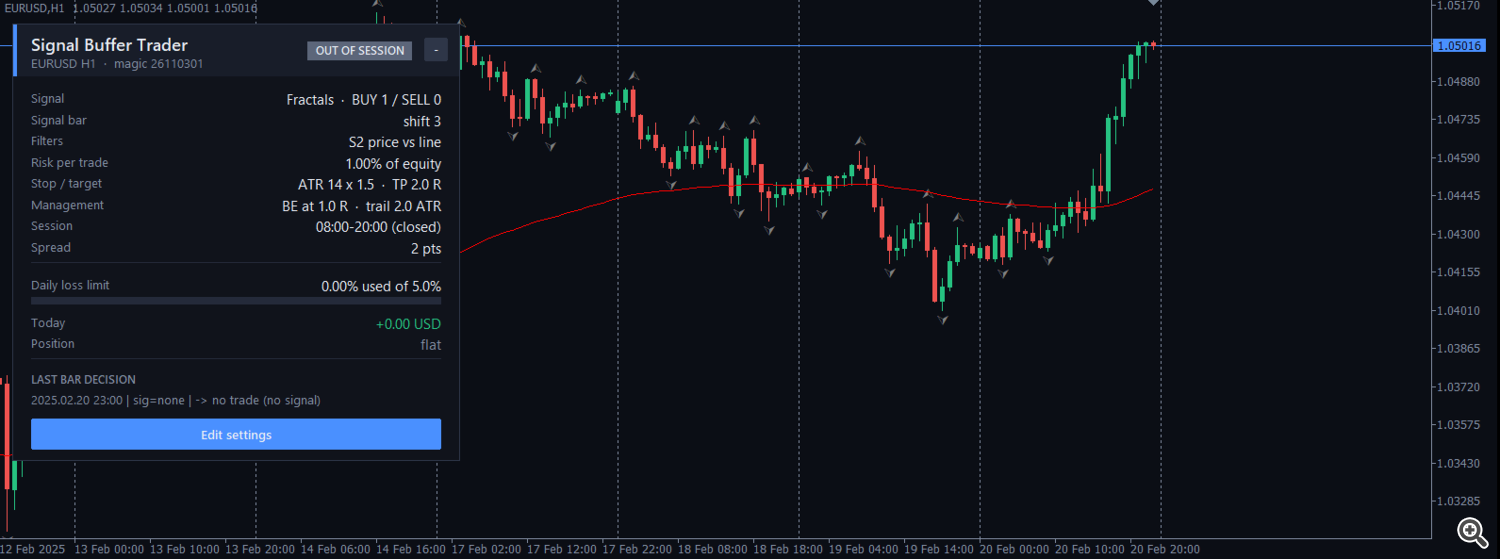
Select the EA, EURUSD H1, a few months of history and visual mode. The dashboard shows what the EA sees on every bar: the signal source, the shift, the filters, the risk, the stops and the decision for the last bar.
Step 6. Read the decision log
The most useful part of a first test is not the balance — it is checking that the EA reads the signal the way you expect. The Experts log has one line per bar:
SBT 2025.01.02 00:00 | sig=SELL(buf0=1.03646) | -> OPEN SELL 0.43 @ 1.03516 SL 1.03748 TP 1.03051 risk 99.76 USD, ticket 2
SBT 2025.01.02 01:00 | sig=none | -> no trade (no signal)
SBT 2025.01.02 06:00 | sig=BUY(buf1=1.03442) | close #2 on opposite signal: done | -> OPEN BUY 0.48 @ 1.03719 SL 1.03516 TP 1.04125 risk 97.44 USD, ticket 4
Each line names the buffer and the value that produced the signal, what happened to an open position, the order with its stop and target, and the money at risk. Compare a few lines with the arrows on the visual chart: if the buffer numbers or the shift were wrong, you would see it here in the first minutes, not after weeks.
Before you trust any result
- The run above is a functional check, not a strategy. Fractals alone are not a trading system, and nothing in this post says how such a setup will perform.
- Test your own indicator and settings in the Strategy Tester on several symbols and periods, then on a demo account, before real money.
- If the inspector reports REPAINTS, treat history arrows with suspicion and judge the indicator only by tester and demo runs.
- Use a stop-loss and a risk you can afford to lose on every trade.
Summary
Automating an arrow indicator comes down to four facts: the BUY buffer, the SELL buffer, the empty value and the shift — plus knowing whether the arrows repaint. You can find them by hand with iCustom() and CopyBuffer() as shown above, or measure them with Signal Buffer Inspector (free) and pass them to Signal Buffer Trader with one file. Either way, check the log before you look at the balance.
Disclosure: I am the developer of Signal Buffer Inspector and Signal Buffer Trader. Everything above can be done by hand with the code shown in the first section.