ExitBand Pro User Manual – Calibrated Stop and Target Probabilities for MetaTrader 5

1. What ExitBand Pro answers
Most trade planning tools tell you how much you can lose. ExitBand Pro tells you what is likely to happen to your stop and your target before you enter.
With this stop loss and this take profit, how likely is price to hit my TP first, my SL first, or neither of them within the next few hours?
ExitBand Pro answers this for 9 common stop/target combinations and updates the answer at every closed bar. The probabilities are calibrated: when ExitBand shows 40%, the event happened about 40% of the time in years of out-of-sample data. ExitBand does not predict direction and gives no entry signals.
| Timeframe | Unit u (expected range) | Trade horizon |
|---|---|---|
| M15 | next 1 hour | 4 hours (16 bars) |
| M30 | next 1 hour | 4 hours (8 bars) |
| H1 | next 4 hours | 16 hours (16 bars) |
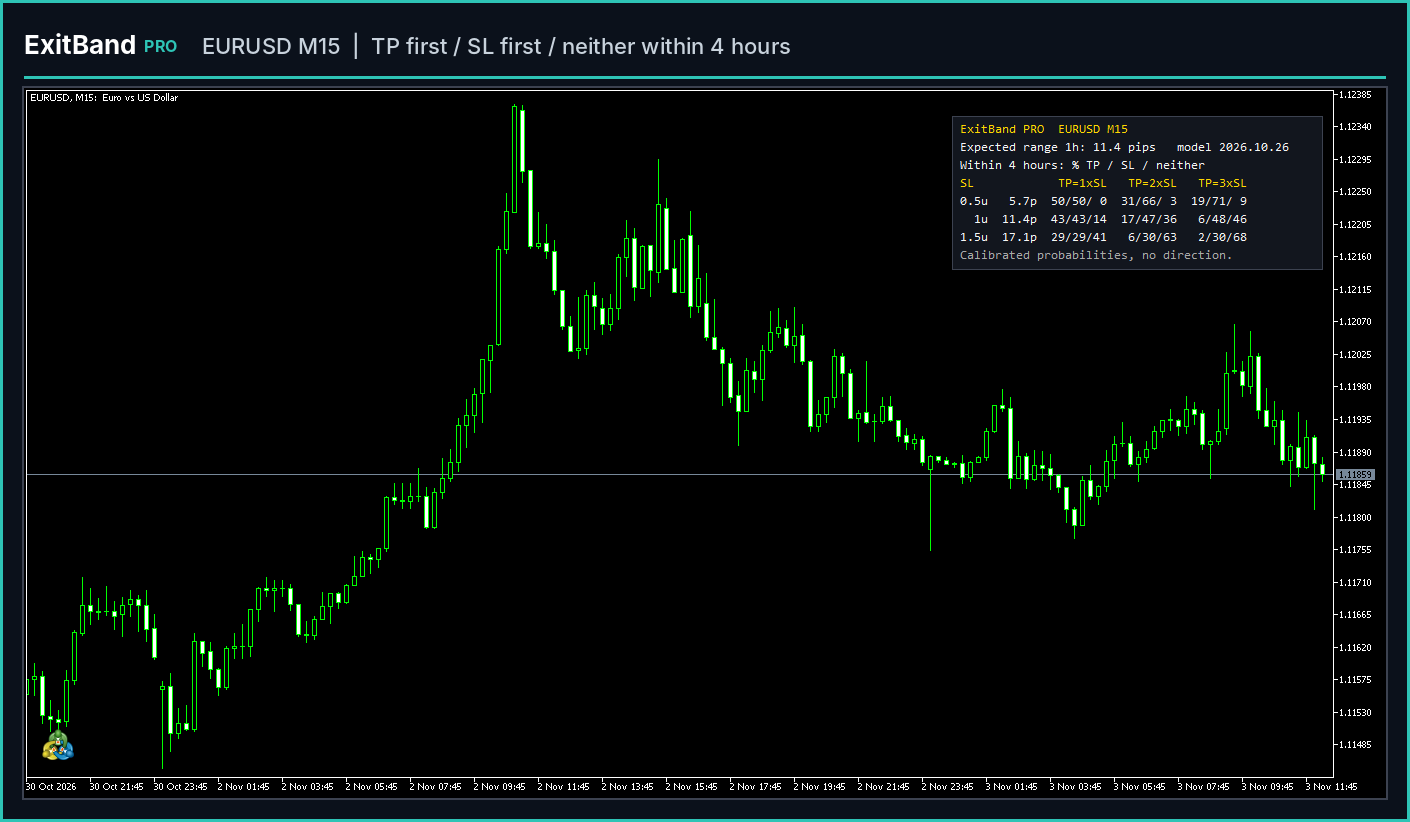
Image 1: EURUSD M15 with the ExitBand Pro panel
2. Reading the panel
- Expected range: how far price is expected to move over the next hour (M15, M30) or the next 4 hours (H1). This distance is the unit u. The panel shows it in pips, together with the date of the current model.
- Rows (SL): three stop sizes, 0.5u, 1u and 1.5u, each also shown in pips.
- Columns (TP): three target sizes, 1x, 2x and 3x the stop.
- Cells: three numbers, % TP first / % SL first / % neither within the horizon. They add up to 100.
Example (EURUSD M15): the cell SL 1u = 11.4 pips, TP 2x = 22.8 pips shows 17 / 47 / 36. Out of 100 trades placed in similar conditions, about 17 reach the target first, 47 reach the stop first, and 36 reach neither within 4 hours.
A high "neither" value is information too: it means the target is far for the time you plan to stay in the trade, and the trade will probably end with a manual or time-based exit.
3. Why the probabilities change during the day
A 10-pip stop is a very different risk at 3 a.m. and at the London open. Fixed rules such as "SL = 1.5 x ATR" ignore this, because ATR looks backward and averages across sessions. ExitBand measures every distance in units of the expected range and then adjusts the probabilities for what comes next:
- Expected range: the VolBand Pro forecast engine, built into ExitBand, estimates the range of the next hour (or 4 hours on H1) from recent volatility and the typical profile of each time slot.
- Session ahead: how active the hours of the trade horizon usually are compared with the next hour. A trade opened just before London has more movement ahead of it than one opened late in the New York session.
- Current conditions: whether today is more or less active than usual, how the last hour compared with its forecast, the time of day, and Monday and Friday effects.
For each of the 9 cells a regularized multinomial logistic model turns these inputs into three probabilities. The model contains no directional information. It is re-estimated every 4 weeks on a rolling window of about 2 years, using only data available at that time. There is no look-ahead and no repainting.
4. How it was validated
Every test was pre-registered: hypotheses, thresholds, code and data were fixed and recorded with SHA-256 hashes before the test, and each test was run once. The calibration requirement was an expected calibration error (ECE) of at most 2 percentage points for P(TP) and P(SL), and every decile with enough observations within 4 points of the observed frequency, on at least 80% of instruments.
- M15, 18 major and cross pairs, 2017–2019 (years never used in development): passed on 18 of 18 pairs. Worst ECE 0.72 points, worst decile deviation 1.45 points.
- M15, 10 exotic pairs never used in any development (USDSEK, USDNOK, EURSEK, EURNOK, USDPLN, EURPLN, USDCZK, USDMXN, USDZAR, USDSGD), 2017–2026: passed on 10 of 10. The test was repeated on a second, independent data feed (7 pairs) with the same result. Worst ECE 0.93 points, worst decile deviation 2.86 points.
- M30 and H1, the same 28 pairs: passed on all of them. Worst ECE 0.69 points, worst decile deviation 2.5 points.
- MetaTrader 5 implementation: the indicator was checked bar by bar against the reference model on EURUSD and USDJPY M15 and on EURUSD M30 and H1. The largest probability difference was below 1e-12.
What these tests do not show. Calibration means the numbers can be trusted as probabilities. It does not mean a strategy built on them is profitable: prices were tested without spread or commission, and ExitBand has no directional edge. A forward test on new data, from November 2026 to February 2027, will check out of sample whether the conditional probabilities are more informative than a fixed table of frequencies. Its results will be published on this blog and in the product comments, whatever they are.
5. Practical uses
- Choose the target before entering. Compare 1x, 2x and 3x for the stop you need. If a 3x target is reached first only 5% of the time in 4 hours, it is a hope, not a plan.
- Size the stop to conditions. A 0.5u stop is touched first about half of the time almost regardless of the target: it behaves like noise. Use the table to see when a stop is too tight for the current range.
- Plan the holding time. A high "neither" value says the trade will probably still be open at the end of the horizon. Decide in advance whether you will hold, close or move the stop.
- Avoid unrealistic setups in quiet hours. The same pip distances look very different in the Asian session. ExitBand shows the change directly.
- Keep a trading journal with numbers. Write down the probabilities of the cell you traded. Over time you can check whether your exits behave as expected.
6. Settings
| Input | Default | Meaning |
|---|---|---|
| Days of history with computed probabilities | 250 | How far back the probability buffers are filled on the chart |
| Show panel, Panel corner, X/Y offset, Font size, colors | – | Panel appearance |
| Publish values (global variables) | true | Publishes the latest values as terminal global variables for other tools (see section 7) |
| Export CSV (verification only) | false | Writes all values to MQL5\Files for independent checking |
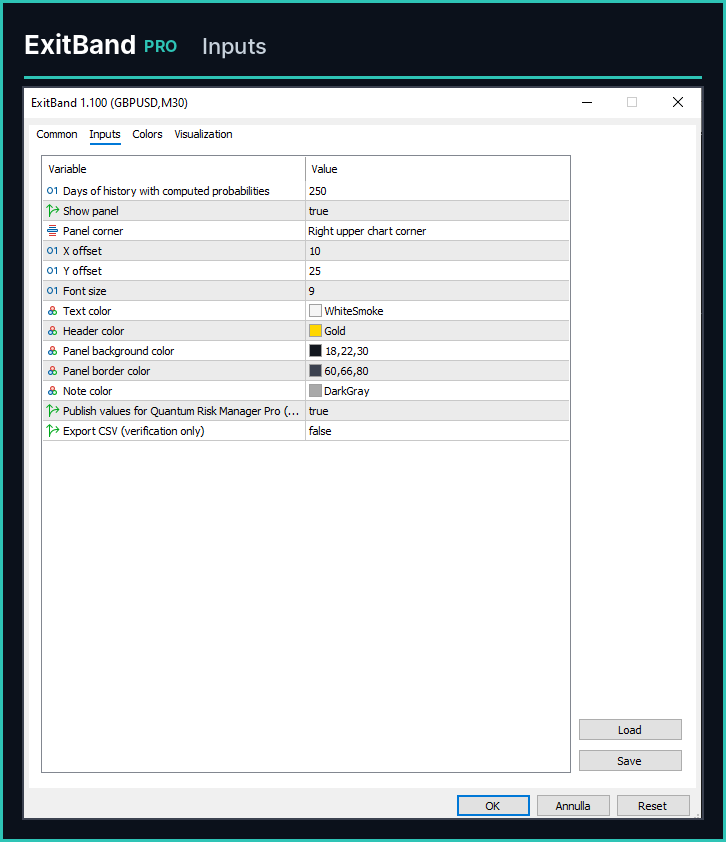
Image 2: Inputs window
Warm-up. The first model needs about 2.5 years of history on the chart's timeframe. With less history the panel shows "Not enough history". Scroll the chart back or open the History Center to download more data. The first calculation takes about 20–30 seconds. After that, each new bar is processed instantly.
Timeframes. M15, M30 and H1. On other timeframes the panel shows "Timeframe not supported" and nothing is calculated.
7. Using ExitBand Pro with Quantum Risk Manager Pro
From version 1.003, Quantum Risk Manager Pro can show the ExitBand probabilities for the setup you are planning. This is optional: both products work on their own.
- Attach ExitBand Pro and Quantum Risk Manager Pro to the same chart (same symbol and timeframe).
- In ExitBand, leave Publish values (global variables) on. In QRM, leave Show ExitBand PRO probabilities on.
- Enter your SL and RR in QRM as usual. The full panel shows the cell nearest to your setup, for example ExitBand 4h: cell SL 1u / TP 2x (your SL 0.94u) and TP first 16% | SL first 46% | neither 37%.
QRM uses a cell only when your SL is within 20% of it (in units of u) and your RR within 0.25. Otherwise it shows "No validated cell" instead of an interpolated number. The information never changes risk, lot size or QRM decisions. If you remove ExitBand from the chart, the two lines disappear within seconds.
QRM PRO user manual: https://www.mql5.com/en/blogs/post/778714
8. For EA developers
All values are available on closed bars through iCustom and CopyBuffer .
| Buffer | Content |
|---|---|
| 0 | Expected range u, in price units |
| 1–3 | Model inputs: volatility surprise, session ahead, current activity |
| 4–30 | Probabilities: buffer = 4 + 3 × cell + outcome |
| cell | 3 × stop index + target index. Stop: 0 = 0.5u, 1 = 1u, 2 = 1.5u. Target: 0 = 1x, 1 = 2x, 2 = 3x |
| outcome | 0 = SL first, 1 = TP first, 2 = neither |
| Example | SL 1u, TP 2x = cell 4 → buffers 16 (SL), 17 (TP), 18 (neither) |
| Empty | EMPTY_VALUE while the model is not available |
int h = iCustom(_Symbol, PERIOD_M15, "Market\\ExitBand Pro Stop and Target Probabilities"); double u[1], pSL[1], pTP[1], pTO[1]; // shift 1 = last closed bar if(CopyBuffer(h, 0, 1, 1, u) == 1 && CopyBuffer(h, 16, 1, 1, pSL) == 1 && CopyBuffer(h, 17, 1, 1, pTP) == 1 && CopyBuffer(h, 18, 1, 1, pTO) == 1 && pTP[0] != EMPTY_VALUE) PrintFormat("u=%.5f TP first %.1f%% SL first %.1f%% neither %.1f%%", u[0], 100*pTP[0], 100*pSL[0], 100*pTO[0]);
The path in iCustom is the name under which the indicator is installed in MQL5\Indicators\Market. Check it in the Navigator if it differs.
9. Limitations
- ExitBand is not a trading system and has no directional edge. It describes how stops and targets are likely to resolve, not where price will go.
- Probabilities are computed on bid prices, without spread or commission. On wide-spread symbols the real chance of reaching a target is lower.
- When the stop and the target are both touched inside the same bar, the outcome counts as a stop. This is conservative.
- On H1 the 16-hour horizon crosses the daily rollover and the overnight session.
- The amount of information varies by symbol. On some pairs, for example NZD crosses on H1, the probabilities remain calibrated but differ less from a fixed table.
- Designed and validated on forex pairs. Other instruments are not validated.
Past calibration does not guarantee future results. Trading involves a risk of loss. Use ExitBand as one input in your own decision process.
Product page: https://www.mql5.com/en/market/product/205757
Related: VolBand Pro User Manual – https://www.mql5.com/en/blogs/post/778651