Version 1.41 for MetaTrader 5 and MetaTrader 4
WHAT REGIMESCOPE DOES
RegimeScope tells you what kind of market you are in right now - trending up, trending down, sideways, unusually quiet, or wild and choppy. It then shows you what happened on your chart the earlier times it looked exactly like now: did price usually go up or down afterwards?
It also shows whether the bigger and smaller timeframes agree with your chart, who won the last candles, and where buyers or sellers defended a price.
RegimeScope does not open trades and never says "buy now". It helps you choose the right kind of trade for the current market, and to skip the trades that usually go wrong. The chapter "How to trade with it" turns this into four concrete buy and sell setups.
GETTING STARTED
THE SEVEN MARKET STATES

The headline always shows one of these seven states. The panel uses the long name; the chart key and the statistics use the short name in brackets.
RegimeScope reads the chart the way a trader does: from the highs and lows of the moves.
When does the state change?
As soon as price has turned by the required amount - there is no extra waiting. While price is pulling back against the current move, STATE AGE shows how far it has come, for example "CHANGING 70% TO DOWN FORMING": price has already come back 70% of the way needed to turn the move. That is your early warning near a top or a bottom.
No indicator that never repaints can know at the top that it was the top. Right after a turn the old state stays until price has come back the full distance - CHANGING shows you that it is coming.
If you prefer fewer changes, set "Reaction speed" to Steady in the settings: a move then has to turn by about 3 average candles instead of 2.
THE PANEL, PART BY PART
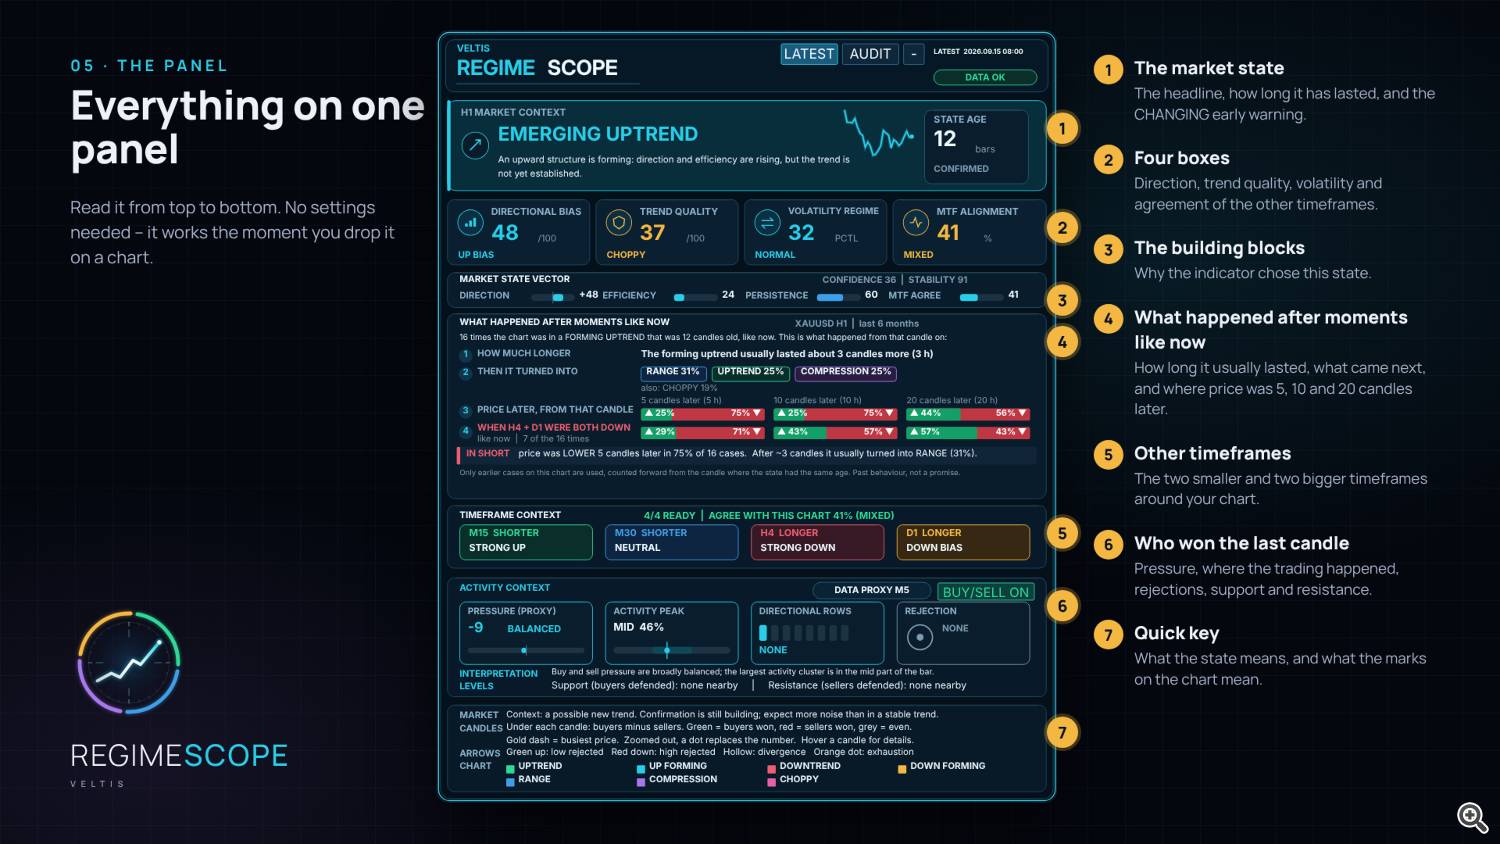
Top bar
The four bars behind the headline. You don't need them to trade, but they show why the indicator chose the state.

This is the heart of RegimeScope. It answers one question: the earlier times my chart looked like now, what happened next?
"Like now" means: the same market state, and the same age. If the market has been in a forming uptrend for 5 candles, the indicator looks for every earlier time the chart had been in a forming uptrend for 5 candles - and checks what happened from that moment on. Each earlier move is counted only once.
At the top you see how many such moments it found, for example: "20 times the chart was in a FORMING UPTREND that was 5 candles old, like now." The header also shows how far back it looked (on H1 about 6 months).
The four rows:
Activity context
This part shows who won the last finished candle.
The - button shrinks the panel to two lines: the market state with its main readings, and who won the last candle. Press + to open the full panel again.
ON THE CHART

The candles themselves are never covered.
Marks on the last 12 candles
The info card
Move the mouse over a marked candle. A card opens with the number of buyers and sellers, who won and by how much, an explanation of any arrow, and a small chart of where inside the candle the buying (green) and selling (red) took place.
Support and resistance
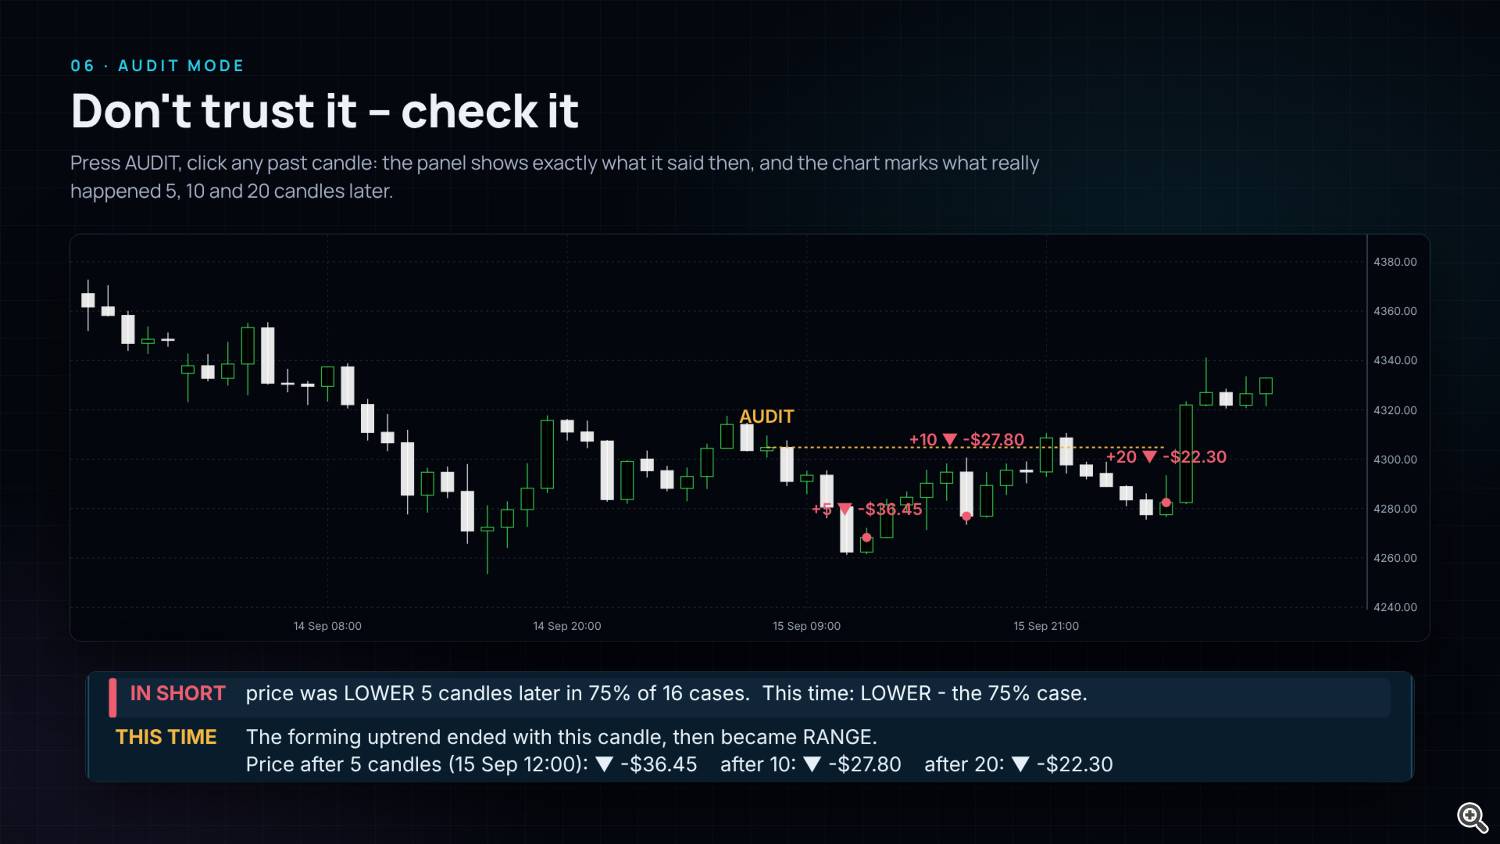
When you click a candle in AUDIT mode:
Coloured background (optional)
If you switch on "Colour the chart background by state" in the settings, the chart background is coloured by the market state at each moment. It is off by default, so your chart keeps its own colours.
AUDIT MODE
HOW TO TRADE WITH IT
Trades are easier to judge when several things point the same way: the market state, the bigger timeframes, what happened after moments like now, and the marks on the last candles. RegimeScope tells you which situation you are in. Your entry and stop come from the chart.
All examples are for illustration. Try every approach on a demo account first and always use a stop loss.
Which timeframe to use
Everything works with the default settings. You only need to change something if you want to.
Market state
Switch on "Alert when the confirmed state changes" and choose pop-up, push notification or e-mail. Push notifications are set up in MetaTrader under Tools -> Options -> Notifications. You get one alert each time the market state changes.
QUESTIONS AND ANSWERS
Does it repaint?
No. It only uses finished candles, and what it said about a finished candle never changes. You can check this with AUDIT.
Why does the state change a bit later than I see it?
A new move only counts once price has turned by about 2 average candles, so small pullbacks don't flip the headline. Until then, CHANGING under STATE AGE shows how close a turn is. If you prefer even fewer changes, set Reaction speed to Steady.
The statistics said LOWER, but price went higher. Is it wrong?
No. If price went lower 60% of the time, it went higher the other 40% - that happens often. The statistics show which side had the edge, not a guarantee. In AUDIT mode you see which side each past candle landed on.
Why are there sometimes only a few cases?
"Like now" is a precise match, and the bigger-timeframe row is even more precise. With few cases the indicator is careful: it shows bars only from 5 cases and names a direction only from 8 cases. Raise "History used, in candles" for more examples.
Which timeframe should I use?
H1 and higher. On M1 and M15 the statistics are close to a coin flip. Use the small timeframes only to time entries in the direction of the bigger chart.
Are the buyer and seller numbers real volume?
Only where the broker provides real trade data (some stocks and futures in MetaTrader 5). On forex and CFDs there is no real volume, so buying and selling are estimated. The panel always says which it is.
A timeframe card says NOT READY.
MetaTrader is still loading that timeframe. It fills in by itself after a few seconds.
It says there isn't enough history yet.
There are too few earlier examples of this situation. Scroll the chart back to load more candles, or raise "History used, in candles".
The panel is too big for my screen.
Lower "Panel size" in the settings, or make the panel small with the - button.
My chart background has changed colour.
That is the setting "Colour the chart background by state". Switch it off in the settings.
Can I use it in an Expert Advisor?
In MetaTrader 5, yes: an EA can read ten values with iCustom - 0 state, 1 direction, 2 efficiency, 3 volatility, 4 persistence, 5 MTF alignment, 6 confidence, 7 stability, 8 transition, 9 data quality.
What is different in MetaTrader 4?
MetaTrader 4 has no real volume data, so buying and selling are always estimated. Only the nine standard timeframes can be used. Everything else works the same.
RISK NOTE
RegimeScope shows market conditions and what happened on your chart in the past. It does not predict the future and does not place trades. The setups are examples for learning, not trading advice. Trading involves risk. Test every approach on a demo account first and always use a stop loss.
WHAT REGIMESCOPE DOES
RegimeScope tells you what kind of market you are in right now - trending up, trending down, sideways, unusually quiet, or wild and choppy. It then shows you what happened on your chart the earlier times it looked exactly like now: did price usually go up or down afterwards?
It also shows whether the bigger and smaller timeframes agree with your chart, who won the last candles, and where buyers or sellers defended a price.
RegimeScope does not open trades and never says "buy now". It helps you choose the right kind of trade for the current market, and to skip the trades that usually go wrong. The chapter "How to trade with it" turns this into four concrete buy and sell setups.
- Works on every symbol and timeframe: forex, gold, indices, oil, crypto, stocks.
- Uses closed candles only, so nothing changes afterwards (no repaint).
- AUDIT mode lets you click any past candle and see what the indicator said then - and what really happened.
Free for the first 100 downloads. $129 after the free licenses have been exhausted
- Open the chart you want to trade. H1 is a good starting point.
- Drag VELTIS RegimeScope onto the chart. The panel opens in the top-left corner.
- The first time, give it a few seconds: it loads the other timeframes in the background.
- Read the panel from top to bottom:
- The big headline: what kind of market it is right now.
- WHAT HAPPENED AFTER MOMENTS LIKE NOW: what usually came next in the same situation.
- TIMEFRAME CONTEXT: do the bigger and smaller timeframes agree?
- Look at the last candles on the chart: the numbers show who won each candle.
THE SEVEN MARKET STATES

The headline always shows one of these seven states. The panel uses the long name; the chart key and the statistics use the short name in brackets.
- STABLE UPTREND (UPTREND) - price is moving up cleanly and steadily. What to do: trade with the trend - buy pullbacks, don't try to sell the top.
- STABLE DOWNTREND (DOWNTREND) - price is moving down cleanly and steadily. What to do: sell rallies, don't try to catch the bottom.
- EMERGING UPTREND (UP FORMING) - an up-move is starting but isn't established yet. What to do: possible early buy, but expect more back-and-forth; use smaller size.
- EMERGING DOWNTREND (DOWN FORMING) - a down-move is starting. What to do: possible early sell, smaller size.
- BALANCED RANGE (RANGE) - price moves sideways, neither buyers nor sellers are in control. What to do: don't chase breakouts; trend trades rarely work here.
- COMPRESSION - the market is unusually quiet; candles are much smaller than normal. What to do: get ready - a bigger move often follows. The direction is not decided yet.
- CHOPPY EXPANSION (CHOPPY) - big candles in both directions, but price goes nowhere. What to do: a difficult market. Wider stops and smaller size, or stay out.
RegimeScope reads the chart the way a trader does: from the highs and lows of the moves.
- A new move starts when price turns by a clear amount - about 2 average candles - away from the last high or low. Smaller pullbacks don't count; the move is still running.
- FORMING means a new move has started but hasn't yet broken the last swing high (for an up move) or the last swing low (for a down move).
- TREND means it has broken it: price made a higher high in an uptrend, or a lower low in a downtrend. A move of 5 average candles or more also counts as a trend, even if the old high or low is still further away.
- Sideways (RANGE, COMPRESSION or CHOPPY) means price hasn't made a new high or low for 12 candles, or neither buyers nor sellers managed to break their last swing while the move stayed small. A move of 3 average candles or more is never called sideways. How busy the market is decides which of the three: COMPRESSION when it's unusually quiet, CHOPPY when it's unusually wild, otherwise RANGE.
When does the state change?
As soon as price has turned by the required amount - there is no extra waiting. While price is pulling back against the current move, STATE AGE shows how far it has come, for example "CHANGING 70% TO DOWN FORMING": price has already come back 70% of the way needed to turn the move. That is your early warning near a top or a bottom.
No indicator that never repaints can know at the top that it was the top. Right after a turn the old state stays until price has come back the full distance - CHANGING shows you that it is coming.
If you prefer fewer changes, set "Reaction speed" to Steady in the settings: a move then has to turn by about 3 average candles instead of 2.
THE PANEL, PART BY PART
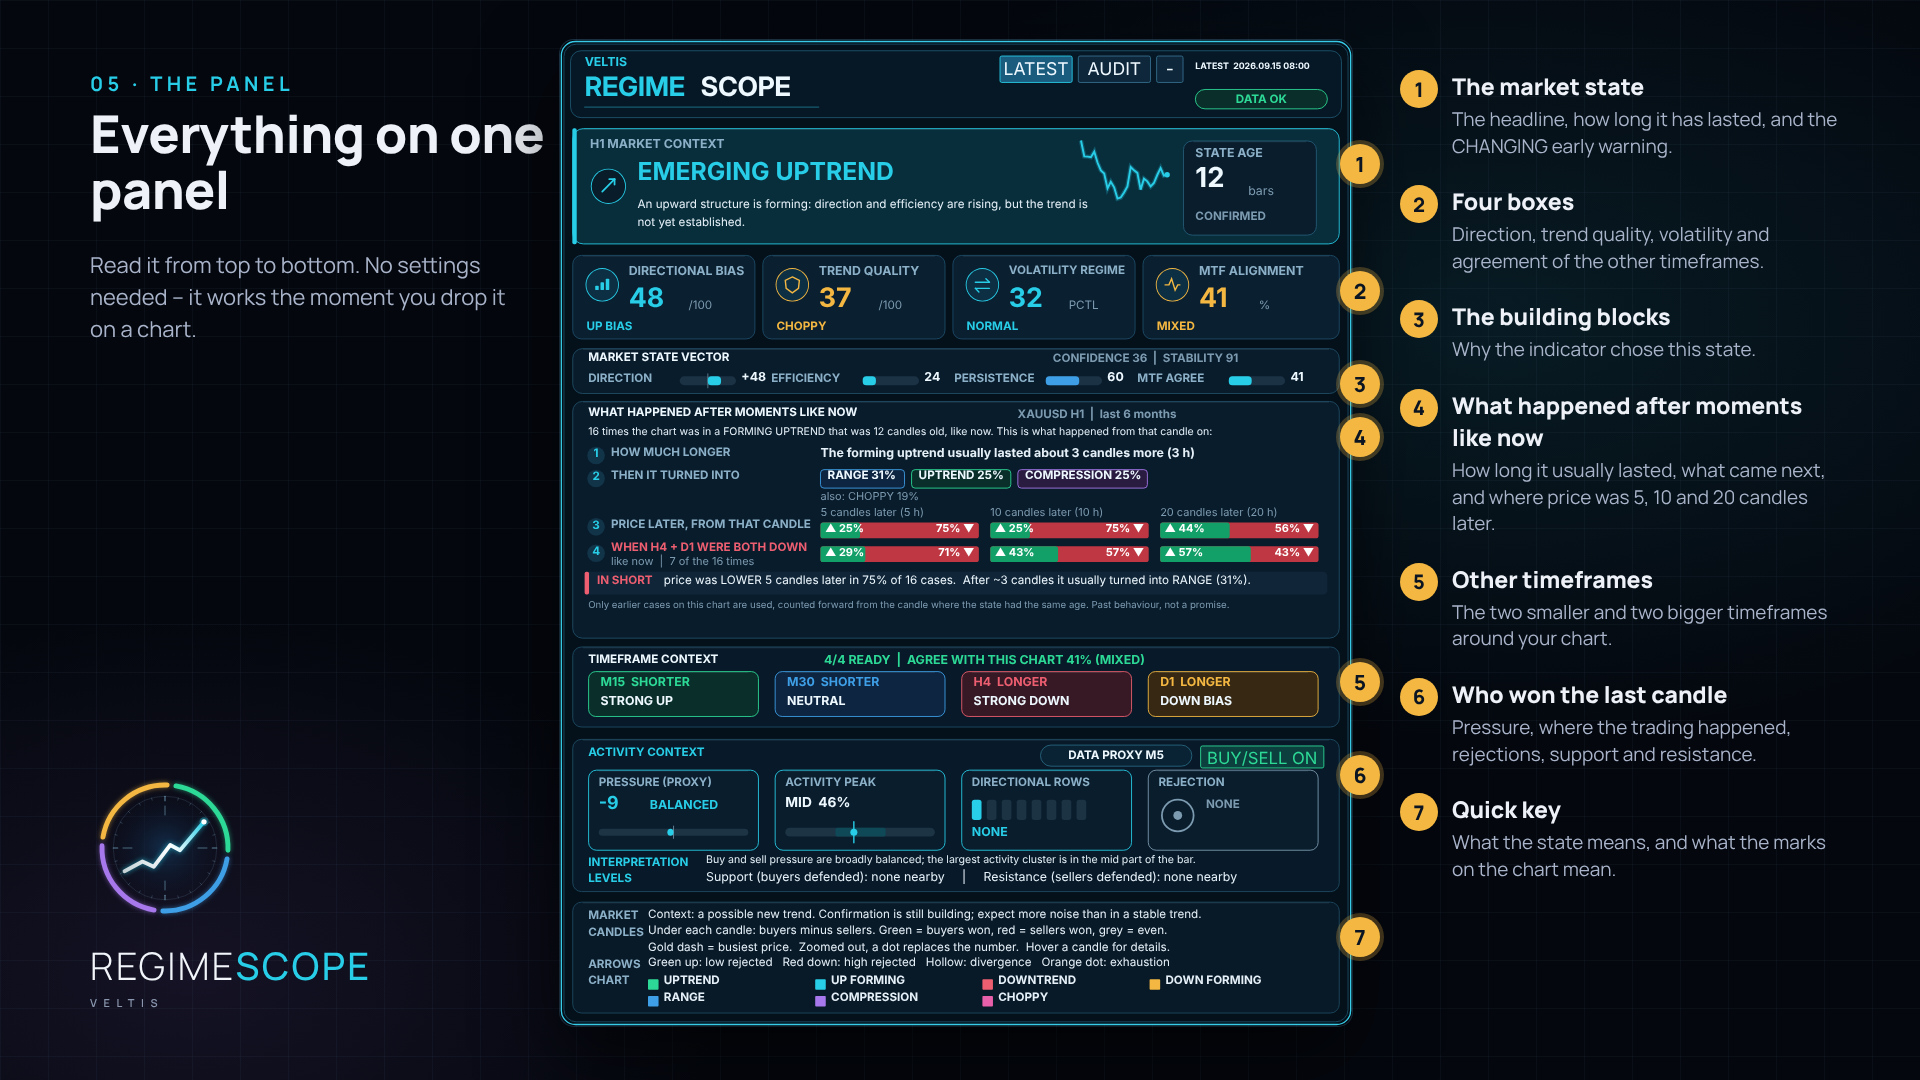
Top bar
- LATEST - the normal mode: the panel always shows the newest finished candle.
- AUDIT - lets you click any past candle and see what the panel showed at that moment. See the chapter "AUDIT mode".
- The - button - makes the panel small. Press + to open it again.
- Date and time - the candle the panel is talking about.
- DATA OK - all other timeframes have loaded. If it says something else (for example PARTIAL MTF), some timeframes are still loading. The main headline still works.
- The headline - the current market state, for example EMERGING UPTREND, with a short explanation underneath.
- The small price line - the last 27 candles, so you see the recent movement at a glance.
- STATE AGE - how many candles the current state has lasted. A young state has just started; an old one may be close to its end.
- CONFIRMED or CHANGING - CONFIRMED means the current move is intact. CHANGING 70% TO DOWN FORMING means price has already come back 70% of the way needed to turn the move into the state named below.
- DIRECTIONAL BIAS - how strongly price is leaning up or down. STRONG UP or STRONG DOWN: a clear push. UP BIAS or DOWN BIAS: a slight lean. NEUTRAL: no direction.
- TREND QUALITY - how clean the movement is. MATURE: a clean, steady trend. DEVELOPING: getting cleaner. MIXED or CHOPPY: lots of back-and-forth, trend trades are harder.
- VOLATILITY REGIME - how big the candles are compared with normal for this chart. COMPRESSION or QUIET: unusually calm. NORMAL. EXPANSION or HIGH EXPANSION: unusually busy - use wider stops or smaller size.
- MTF ALIGNMENT - how much the other timeframes agree with your chart. ALIGNED (75% or more): the bigger picture backs your chart. PARTIAL or MIXED: some agree, some don't. DIVERGENT (below 35%): the timeframes point different ways - be careful.
The four bars behind the headline. You don't need them to trade, but they show why the indicator chose the state.
- DIRECTION - which way the current move goes and how far it has come, measured from where it started. Plus = up, minus = down. Around 50 the move has just started; 90 or more is a big move.
- EFFICIENCY - how straight the current move is: real progress instead of back-and-forth. High = clean move.
- PERSISTENCE - how many of the candles in the current move went in its direction. High = steady.
- MTF AGREE - the same as MTF ALIGNMENT.
- CONFIDENCE - how clearly the market fits the state shown: for a trend, how far and how straight the move went; for a sideways market, how long it has gone nowhere.
- STABILITY - how settled the state is. Low right after a change, higher the longer it lasts.
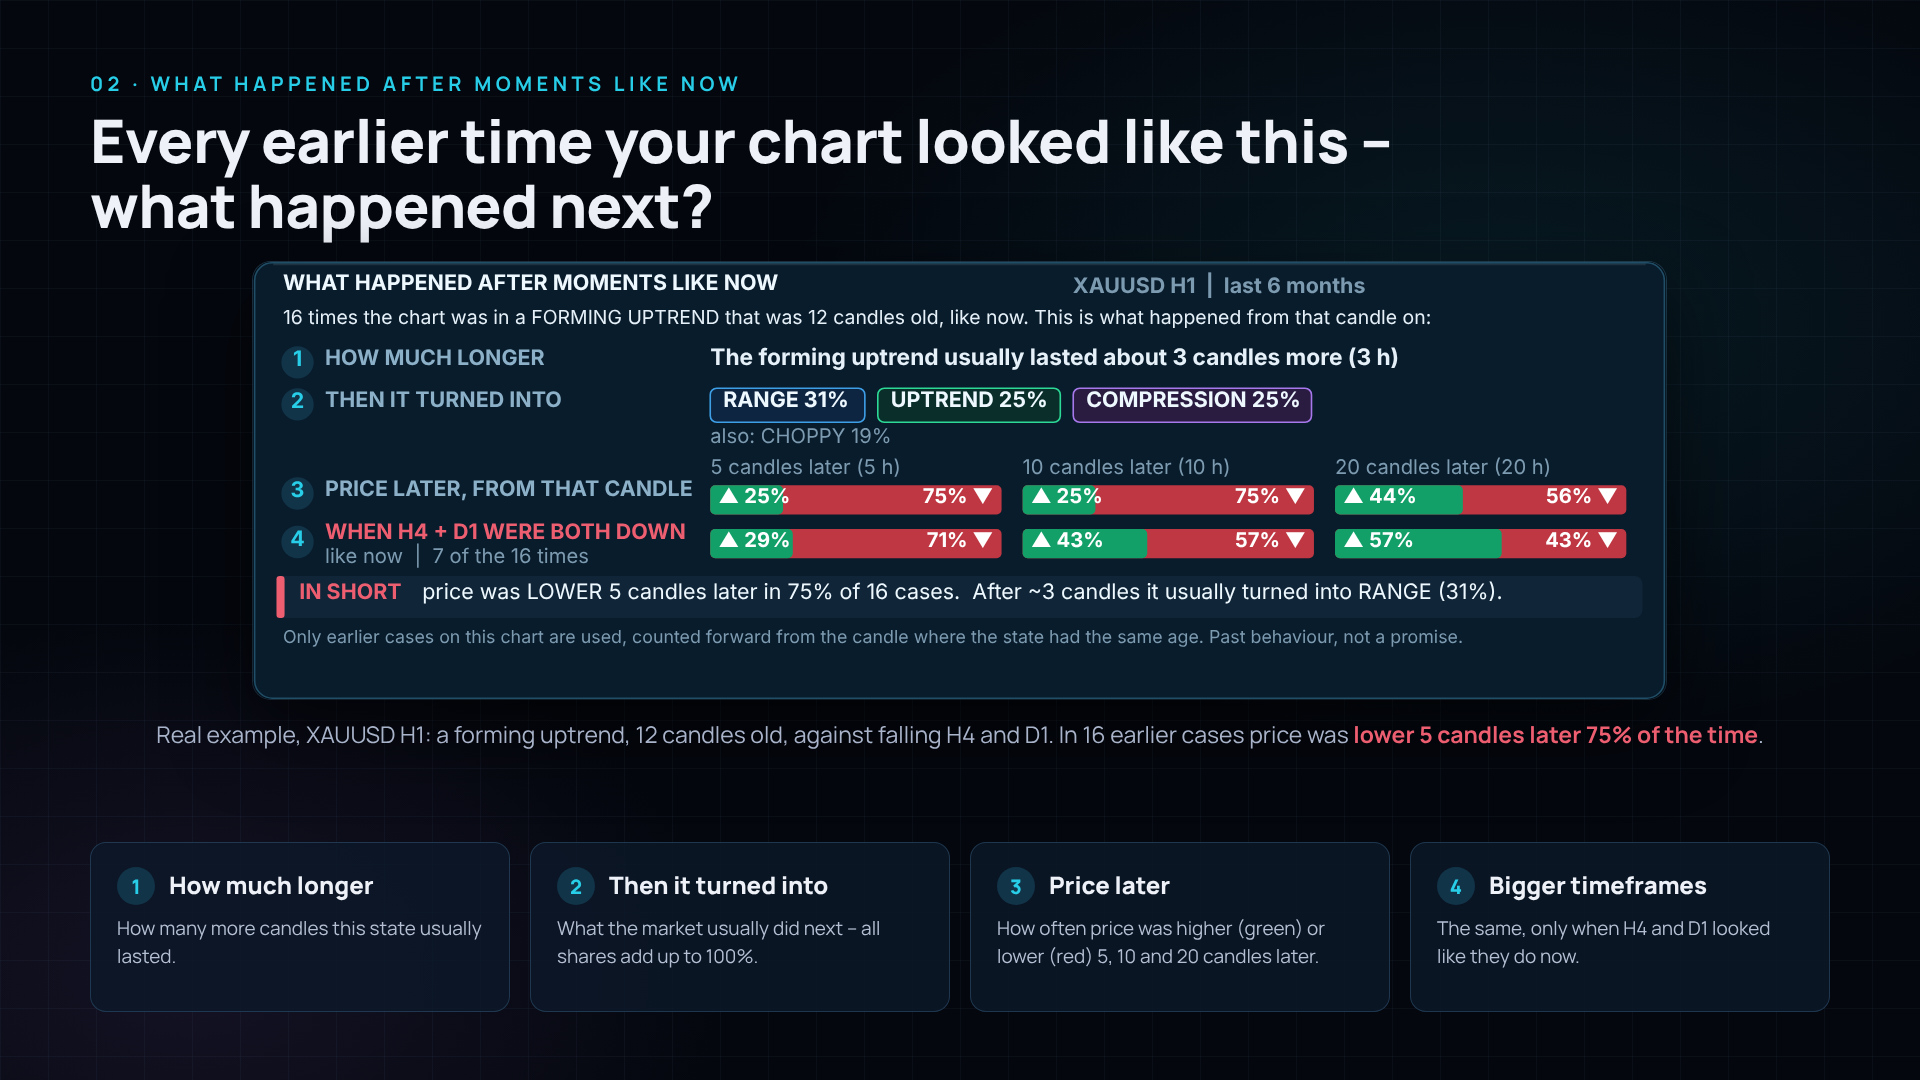
This is the heart of RegimeScope. It answers one question: the earlier times my chart looked like now, what happened next?
"Like now" means: the same market state, and the same age. If the market has been in a forming uptrend for 5 candles, the indicator looks for every earlier time the chart had been in a forming uptrend for 5 candles - and checks what happened from that moment on. Each earlier move is counted only once.
At the top you see how many such moments it found, for example: "20 times the chart was in a FORMING UPTREND that was 5 candles old, like now." The header also shows how far back it looked (on H1 about 6 months).
The four rows:
- HOW MUCH LONGER - how many more candles this state usually lasted. Example: "The forming uptrend usually lasted about 3 candles more." What it means for you: if only a few candles are usually left, a late entry in the direction of the state is risky.
- THEN IT TURNED INTO - what the market usually did next, for example RANGE 30%, COMPRESSION 30%, CHOPPY 15%. The line below lists the rest. All numbers together make 100%.
- PRICE LATER, FROM THAT CANDLE - three bars for 5, 10 and 20 candles later. Green (▲) shows how often price was higher, red (▼) how often it was lower. Example: ▲ 40% ▼ 60% means price was lower 6 out of 10 times.
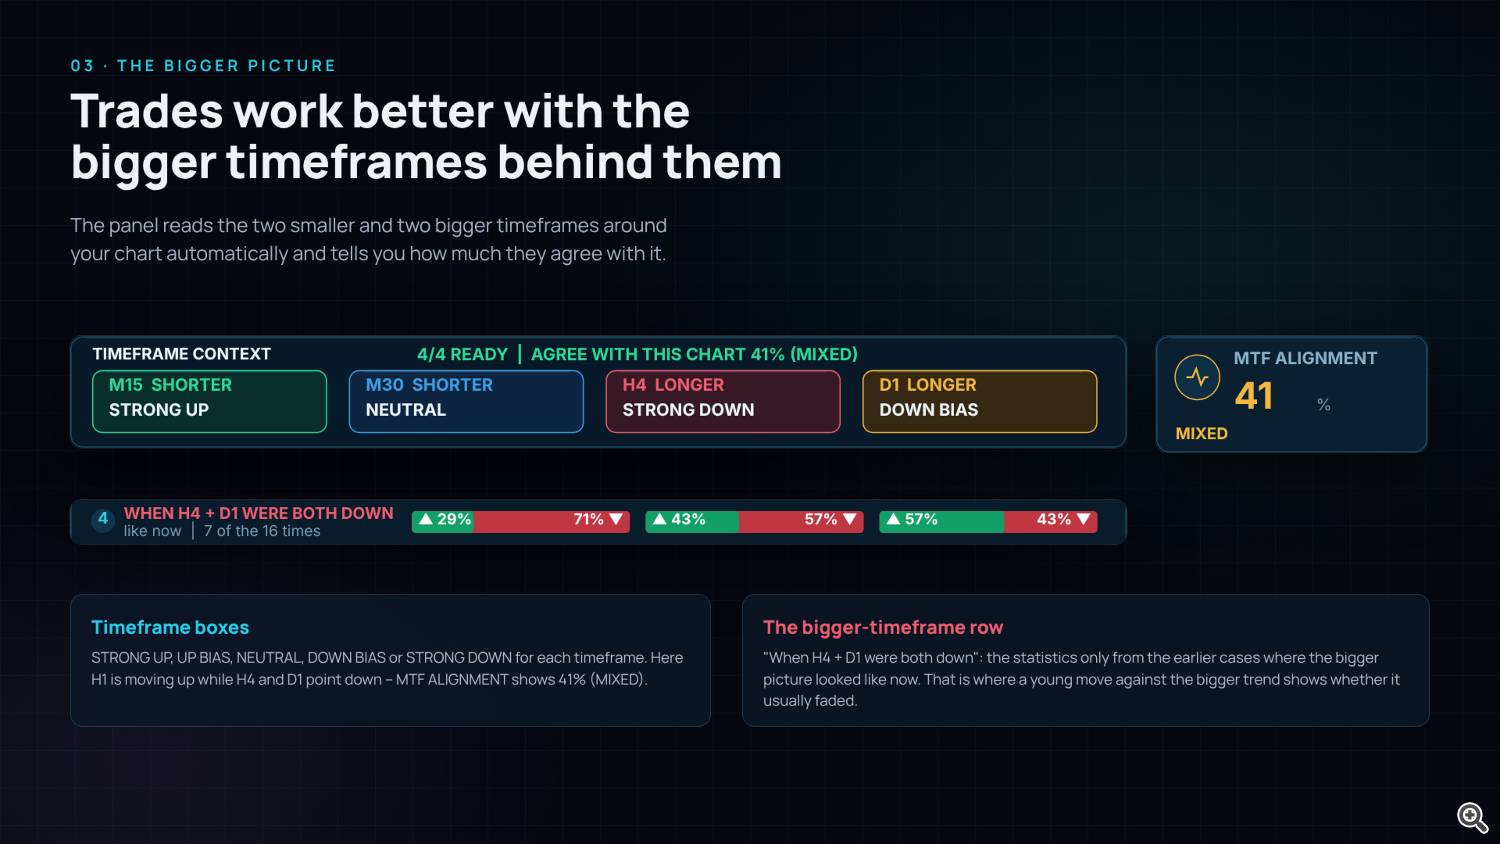
- WHEN H4 + D1 WERE BOTH DOWN (or BOTH UP, or DISAGREED) - the same three bars, but only for the times when the bigger timeframes looked like they do now. The line underneath says how many times that was. This row is especially useful when your chart and the bigger timeframes point different ways.
- Green bar on the left: price usually went higher.
- Red: price usually went lower.
- Amber, "NO CLEAR DIRECTION": up and down happened about equally often. Don't rely on the statistics then.
- 58% or more in one direction counts as a real edge. Between 42% and 58% it is close to a coin flip.
- More cases = more reliable. 60% from 50 cases means more than 60% from 8 cases. If there are too few cases, the indicator says so instead of showing a number.
- 60% is not 100%. If price went lower 60 times out of 100, it went higher 40 times. That happens often. The statistics tell you which side had the edge, not what will happen this time.
- Only the past of the chart you are looking at is used.
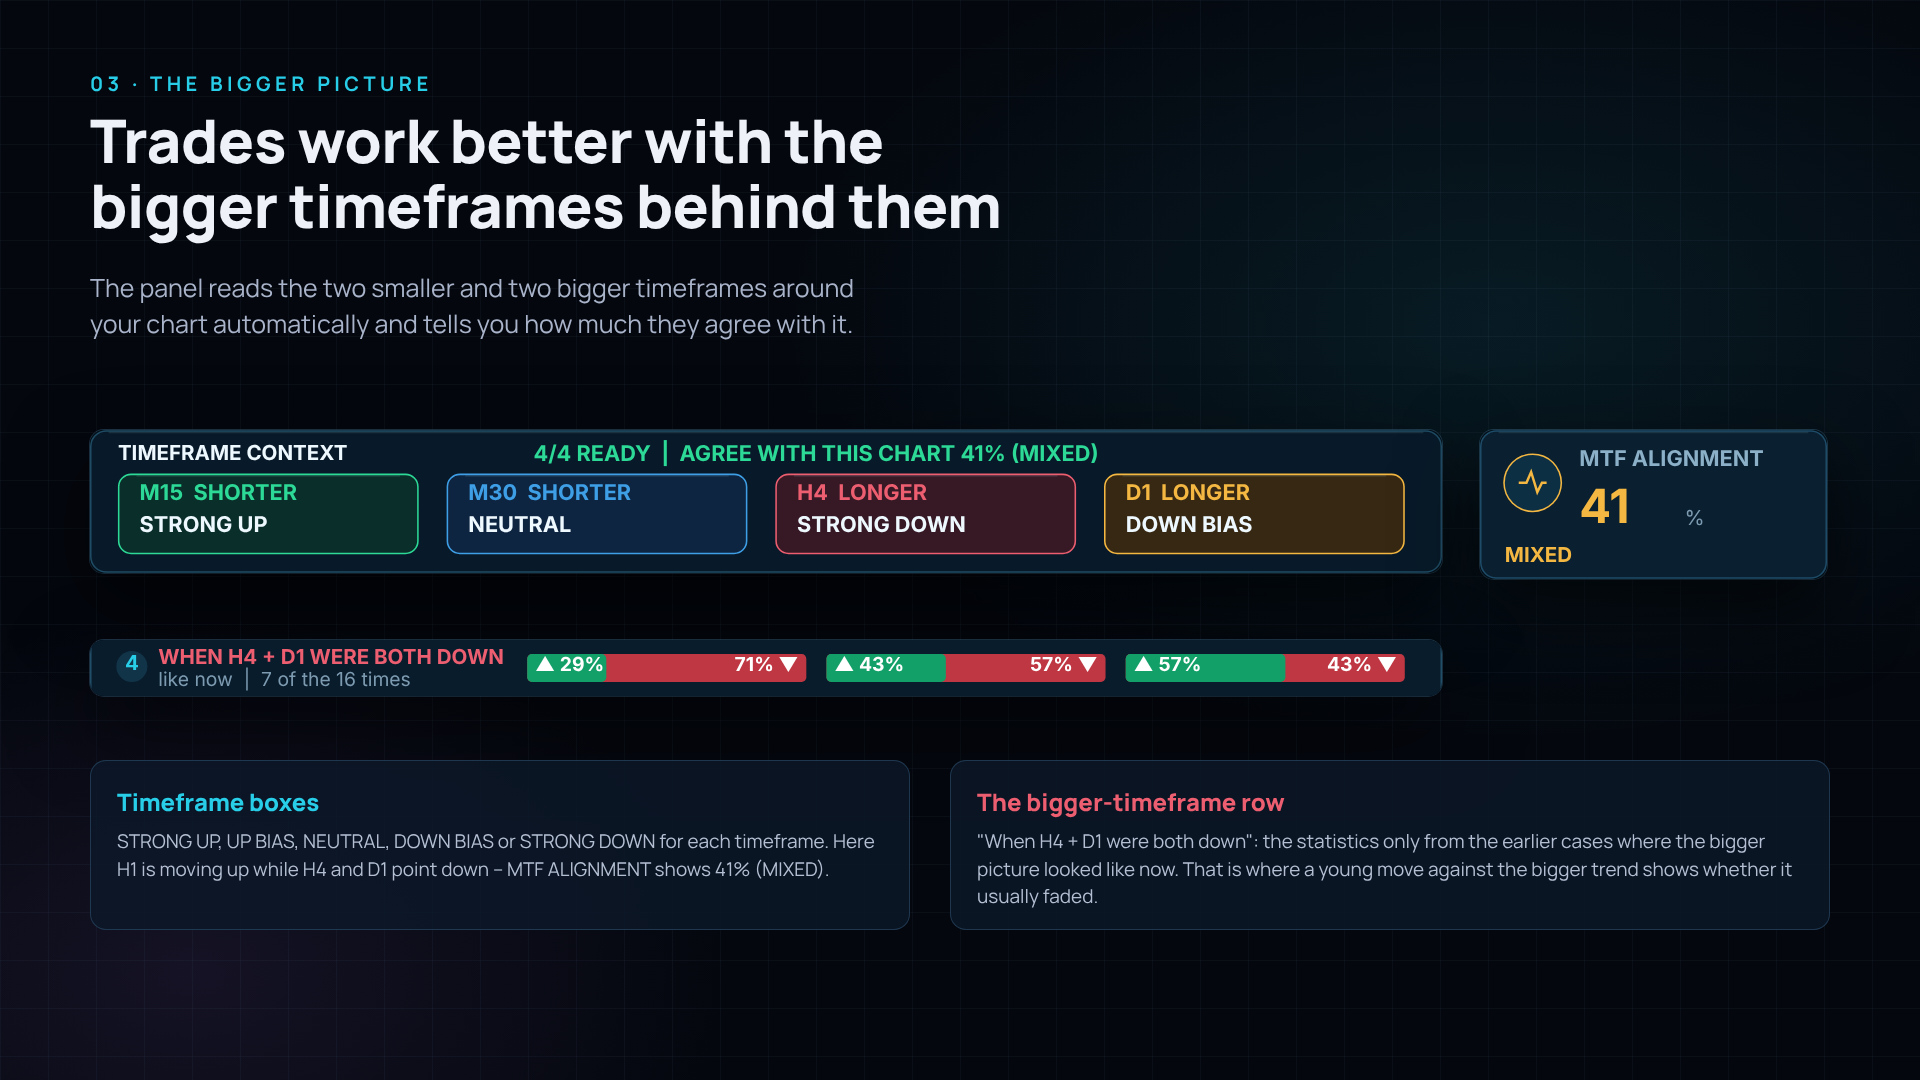
- The header - how many of the four other timeframes have loaded, and how much they agree with your chart (for example "AGREE WITH THIS CHART 28% (DIVERGENT)").
- Four cards - the two smaller and two bigger timeframes around your chart (on H1: M15, M30, H4, D1). Each shows its own direction: STRONG UP, UP BIAS, NEUTRAL, DOWN BIAS or STRONG DOWN. NOT READY means it is still loading.
Activity context
This part shows who won the last finished candle.
- PRESSURE - buyers against sellers, from -100 (only sellers) to +100 (only buyers). BUYING or SELLING: one side won. BALANCED: about even.
- ACTIVITY PEAK - where in the candle most of the trading happened: at the top (UPPER), in the middle (MID) or at the bottom (LOWER).
- DIRECTIONAL ROWS - whether one side dominated several price levels in a row inside the candle. BULL x4: buyers dominated 4 levels in a row. NONE: no clear run.
- REJECTION - whether one side pushed to the edge of the candle and was pushed back. BULLISH: sellers were rejected at the low (a good sign for buyers). BEARISH: buyers were rejected at the high.
- INTERPRETATION - all of the above in one sentence.
- LEVELS - the nearest support (where buyers defended) and resistance (where sellers defended), or "none nearby".
- DATA PROXY M5 - where the data comes from. On forex and CFDs there is no real volume, so buying and selling are estimated from smaller candles. With real trade data it says REAL TRADES.
- BUY/SELL ON / OFF - shows or hides the numbers and arrows on the chart.
- MARKET - what the current state means for your trading, in one sentence.
- CANDLES and ARROWS - a short key to the marks on the chart.
- CHART - the colour key, shown when you switch on the coloured chart background.
The - button shrinks the panel to two lines: the market state with its main readings, and who won the last candle. Press + to open the full panel again.
ON THE CHART

The candles themselves are never covered.
Marks on the last 12 candles
- Number under a candle - buyers minus sellers. Green: buyers won the candle. Red: sellers won. Grey: about even. "K" means thousand. When zoomed out, the number becomes a coloured dot.
- Gold dash on the candle - the price where most trading happened in that candle.
- Green arrow up, under the candle - sellers pushed price down hard, but it closed well above the low. Sellers were rejected - a good sign for buyers.
- Red arrow down, above the candle - buyers pushed price up hard, but it closed well below the high. Buyers were rejected - a good sign for sellers.
- Hollow arrow - a warning: price made a new low but buyers were stronger (hollow up), or a new high but sellers were stronger (hollow down). The move may be running out of steam.
- Orange dot - a very busy candle, but neither side won. Often seen near the end of a move.
The info card
Move the mouse over a marked candle. A card opens with the number of buyers and sellers, who won and by how much, an explanation of any arrow, and a small chart of where inside the candle the buying (green) and selling (red) took place.
Support and resistance
- Red band "Resistance ... - sellers defended here" - buyers pushed up to this price and were pushed back. Expect sellers there again. It stays until a candle closes above it.
- Green band "Support ... - buyers defended here" - sellers pushed down to this price and were pushed back. Expect buyers there again. It stays until a candle closes below it.
- Only levels close to the current price are shown, so the chart stays clean. Move the mouse over a band to see when it was created.
When you click a candle in AUDIT mode:
- AUDIT appears above that candle, with an amber dotted line at its closing price.
- +5, +10 and +20 appear above the candles 5, 10 and 20 later, for example "+5 ▲ +$38.12". Green: price was higher than at your candle. Red: lower.
Coloured background (optional)
If you switch on "Colour the chart background by state" in the settings, the chart background is coloured by the market state at each moment. It is off by default, so your chart keeps its own colours.
AUDIT MODE
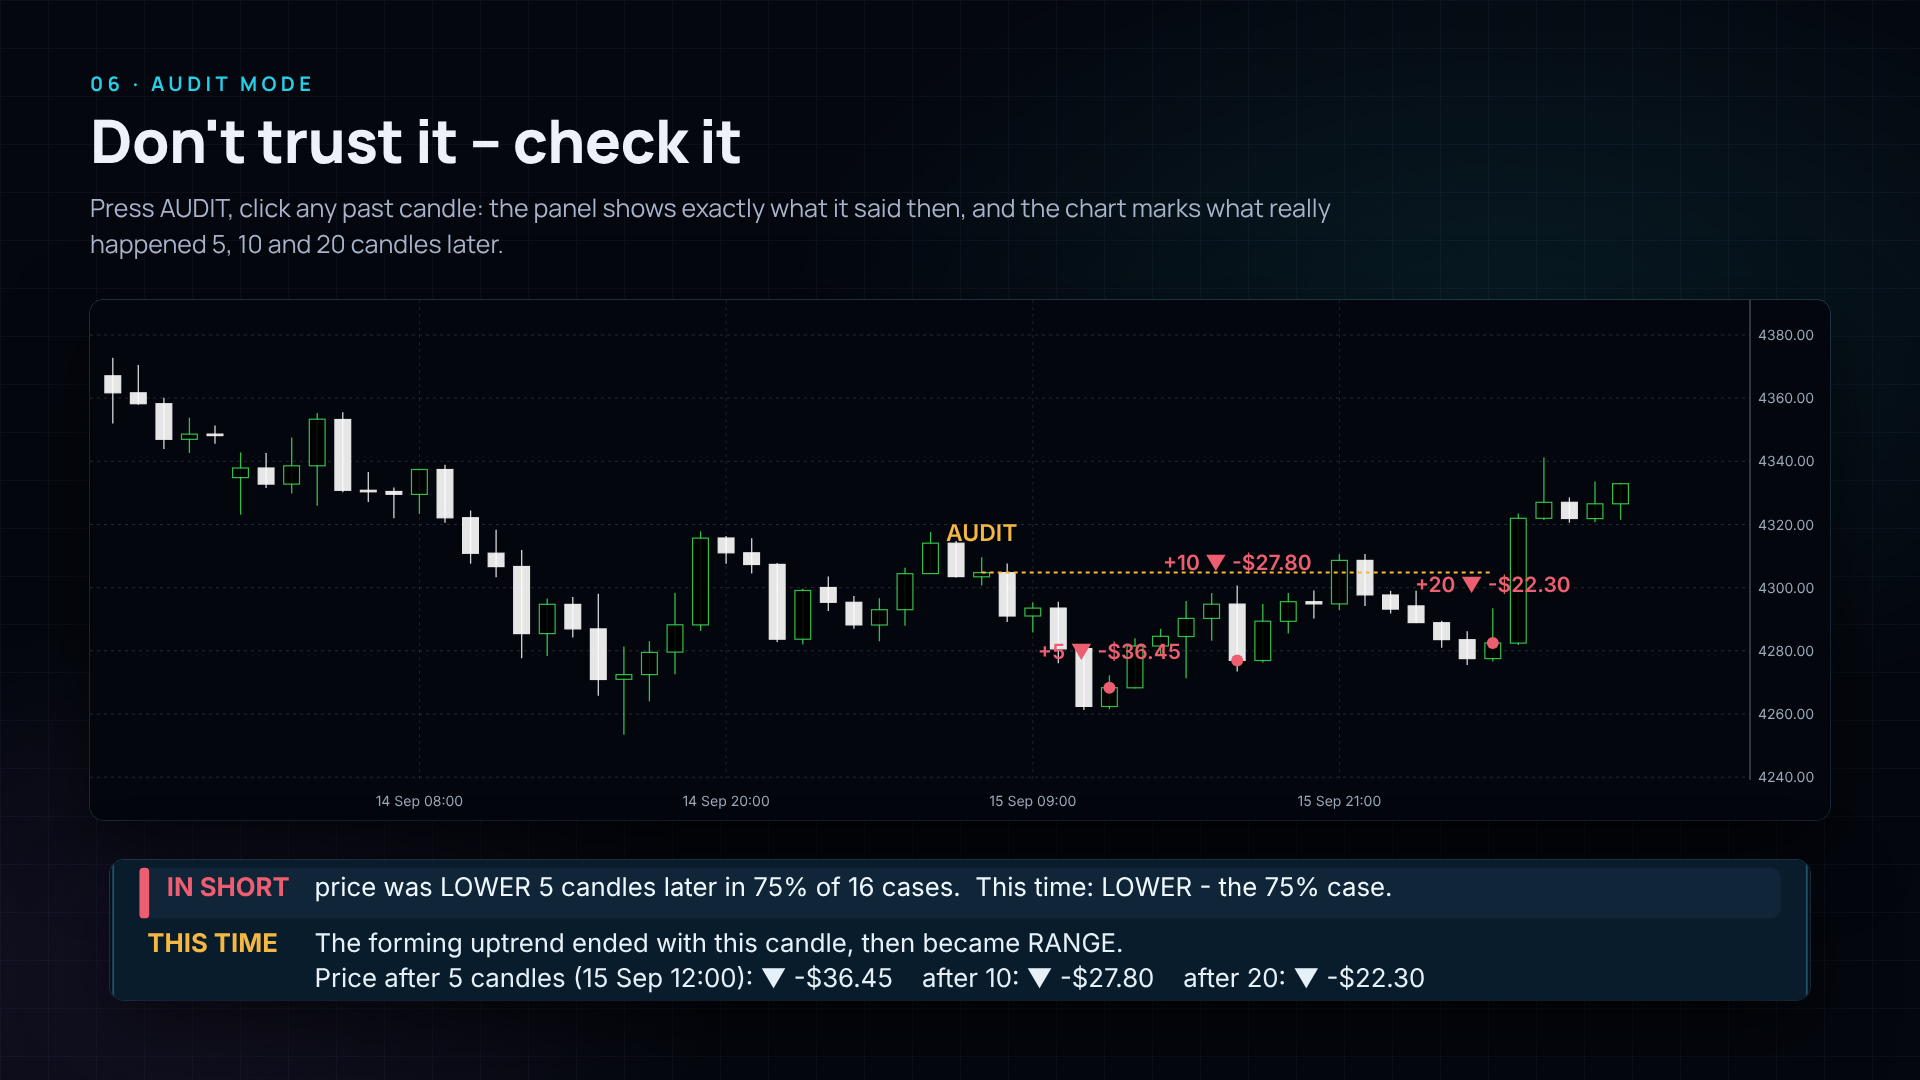
- Press AUDIT on the panel.
- Click any finished candle on the chart.
- The whole panel shows what it said when that candle closed. Under IN SHORT you see what really happened, for example "This time: HIGHER - the 40% case". The line THIS TIME shows how long the state still lasted and how far price moved after 5, 10 and 20 candles. The chart marks the same candles.
- Click another candle, or press LATEST to go back.
HOW TO TRADE WITH IT
Trades are easier to judge when several things point the same way: the market state, the bigger timeframes, what happened after moments like now, and the marks on the last candles. RegimeScope tells you which situation you are in. Your entry and stop come from the chart.
All examples are for illustration. Try every approach on a demo account first and always use a stop loss.
Which timeframe to use
- H4 and D1 - the big picture: which direction to trade.
- H1 - the main chart for decisions.
- M15 and M5 - to fine-tune the entry in the direction of H1.
- M1 - not for decisions. On very small timeframes the statistics are close to a coin flip.
- Headline: what kind of market is it? Avoid CHOPPY.
- HOW MUCH LONGER: does the state usually have several candles left, or does it usually end about now?
- MTF ALIGNMENT: 75% or more is good. Below 35%, stay out.
- IN SHORT: is it green or red in your direction? Amber means no edge.
- The last candles: do the numbers and arrows show your side winning? Is a support or resistance band in the way?
- Decide: trade, wait, or skip.
- When: the headline has just changed to UP FORMING or DOWN FORMING, MTF ALIGNMENT is 75% or more, and IN SHORT agrees with the direction.
- Entry: wait for a small move against the trend (1-3 candles). Enter when a candle closes with a number for your side - red for a sell, green for a buy - ideally with an arrow or at a band.
- Stop: beyond the high (sell) or low (buy) of that small counter-move.
- Exit: when CHANGING climbs above about 70% against you, or the headline turns into the opposite FORMING state, RANGE or CHOPPY.
- Example (gold, H1): the headline changes from RANGE to DOWN FORMING after two big red candles. H4 and D1 are down, MTF ALIGNMENT is 80%, and IN SHORT says LOWER. Two small candles bounce up towards the resistance band, then a candle closes with a red number and a red arrow. Sell at the close, stop above the band.
- When: the state is COMPRESSION, and IN SHORT names a clear direction (60% or more).
- Entry: wait until the headline changes to UP FORMING or DOWN FORMING in that direction, then enter at the close of that candle.
- Stop: back inside the quiet range.
- Skip: if the market breaks the other way and the bigger timeframes don't support it.
- Example (gold, H1): COMPRESSION for 5 candles. With H4 and D1 down, price was lower 10 candles later in 63% of 16 cases. You ignore a weak push up. Four candles later the headline turns DOWN FORMING after a fast drop. Sell at the close, stop above the quiet range.
- When: UPTREND or DOWNTREND, HOW MUCH LONGER says the trend usually lasts at least 5 more candles, and MTF ALIGNMENT is 60% or more.
- Entry: after a few candles against the trend, enter when a candle closes with a number for the trend side, ideally at a support band (buy) or resistance band (sell), or with a rejection arrow.
- Stop: beyond the end of the pullback.
- Exit: when CHANGING climbs above about 70% against you, or the headline turns sideways or into the opposite direction.
- Example (gold, H1): UPTREND for 6 candles; HOW MUCH LONGER says about 9 more. Price pulls back three candles to the support band at 4,021. The third candle shows a green arrow and a green number. Buy at the close, stop below 4,018.
- When: HOW MUCH LONGER says the trend usually ends about now, THEN IT TURNED INTO shows mostly RANGE or the opposite direction, and price reaches a band against the trend.
- Entry: after a hollow arrow, a rejection arrow or an orange dot, when CHANGING climbs above 50% or the headline turns into the opposite FORMING state. Enter on the next candle whose number favours the turn.
- Stop: beyond the high or low of the signal candle. Use small size - this trade goes against the trend.
- Example (gold, H1): UPTREND for 18 candles; HOW MUCH LONGER says it usually ended about now. At the resistance band a red arrow and an orange dot appear, and two candles later the panel shows CHANGING 80% TO DOWN FORMING. Sell the next candle with a red number, stop above the high.
- The state is CHOPPY.
- MTF ALIGNMENT is below 35%.
- IN SHORT says NO CLEAR DIRECTION, or there are too few cases.
- A support or resistance band is right in front of your trade.
- You would enter a trend that usually ends about now.
- You are deciding on M1 alone.
- Important news is coming.
Everything works with the default settings. You only need to change something if you want to.
Market state
- History used, in candles (3000) - how far back the indicator looks. More history means more past examples; useful on M1 to M15.
- Reaction speed (Balanced) - Balanced: a move counts as turned when price comes back about 2 average candles. Steady: about 3 - fewer changes, but later.
- Automatic (on) - the indicator picks the two smaller and two bigger timeframes for you. Switch it off to choose four timeframes yourself.
- Colour the chart background by state (off), how many candles are coloured (600) and how strong the colour is (14%).
- Buy/sell marks under the candles (on) and on how many candles (12).
- Support / resistance (on) and how far from the price they may be (3.0).
- Font size on the chart (11).
- Corner, distance from the side and top - where the panel sits.
- Panel size (100%) - make it smaller if it doesn't fit your screen.
- Panel opacity (100%) - lower it to see the chart through the panel.
- Start minimised (off).
- Alert when the confirmed state changes (off) - then choose pop-up, push notification to your phone, or e-mail.
Switch on "Alert when the confirmed state changes" and choose pop-up, push notification or e-mail. Push notifications are set up in MetaTrader under Tools -> Options -> Notifications. You get one alert each time the market state changes.
QUESTIONS AND ANSWERS
Does it repaint?
No. It only uses finished candles, and what it said about a finished candle never changes. You can check this with AUDIT.
Why does the state change a bit later than I see it?
A new move only counts once price has turned by about 2 average candles, so small pullbacks don't flip the headline. Until then, CHANGING under STATE AGE shows how close a turn is. If you prefer even fewer changes, set Reaction speed to Steady.
The statistics said LOWER, but price went higher. Is it wrong?
No. If price went lower 60% of the time, it went higher the other 40% - that happens often. The statistics show which side had the edge, not a guarantee. In AUDIT mode you see which side each past candle landed on.
Why are there sometimes only a few cases?
"Like now" is a precise match, and the bigger-timeframe row is even more precise. With few cases the indicator is careful: it shows bars only from 5 cases and names a direction only from 8 cases. Raise "History used, in candles" for more examples.
Which timeframe should I use?
H1 and higher. On M1 and M15 the statistics are close to a coin flip. Use the small timeframes only to time entries in the direction of the bigger chart.
Are the buyer and seller numbers real volume?
Only where the broker provides real trade data (some stocks and futures in MetaTrader 5). On forex and CFDs there is no real volume, so buying and selling are estimated. The panel always says which it is.
A timeframe card says NOT READY.
MetaTrader is still loading that timeframe. It fills in by itself after a few seconds.
It says there isn't enough history yet.
There are too few earlier examples of this situation. Scroll the chart back to load more candles, or raise "History used, in candles".
The panel is too big for my screen.
Lower "Panel size" in the settings, or make the panel small with the - button.
My chart background has changed colour.
That is the setting "Colour the chart background by state". Switch it off in the settings.
Can I use it in an Expert Advisor?
In MetaTrader 5, yes: an EA can read ten values with iCustom - 0 state, 1 direction, 2 efficiency, 3 volatility, 4 persistence, 5 MTF alignment, 6 confidence, 7 stability, 8 transition, 9 data quality.
What is different in MetaTrader 4?
MetaTrader 4 has no real volume data, so buying and selling are always estimated. Only the nine standard timeframes can be used. Everything else works the same.
RISK NOTE
RegimeScope shows market conditions and what happened on your chart in the past. It does not predict the future and does not place trades. The setups are examples for learning, not trading advice. Trading involves risk. Test every approach on a demo account first and always use a stop loss.