VISTLAB — A Laboratory for Studying the Market Through Time (iVISTscalp5)

VISTLAB — A Laboratory for Studying the Market Through Time
From Knowledge to Understanding. From Understanding to Practice.
VISTLAB is a practical laboratory created within the VISTmany project to explore the temporal structure of financial markets and master the methodology of Liquidity Activation Points (LAP).
We provide researchers and traders with the opportunity to explore timings, analyze price action, identify hidden temporal patterns, develop analytical reasoning, and apply time-based forecasting to live trading.
Our primary goal is to provide the foundational knowledge and analytical tools for learning. How deeply an individual chooses to explore the methodology, the amount of time dedicated to practice, and how they apply these skills depend entirely on their own interest, discipline, and commitment to self-development.
1. What Can You Learn in VISTLAB?
The laboratory is built on the concept of evaluating financial markets through a temporal dimension. Instead of focusing solely on price levels, traders receive pre-calculated temporal coordinates. These coordinates help pinpoint upcoming moments of liquidity activation, allowing traders to systematically observe how price behaves around these specific temporal points.
Every LAP timing contains three fundamental parameters:
-
Time Coordinate: The pre-computed activation timestamp.
-
Directional Vector: The calculated market bias (BUY or SELL).
-
Expected Amplitude: The projected price movement magnitude measured in points.
By evaluating these parameters alongside price charts, you can progressively master the core temporal concepts of the VISTmany framework:
-
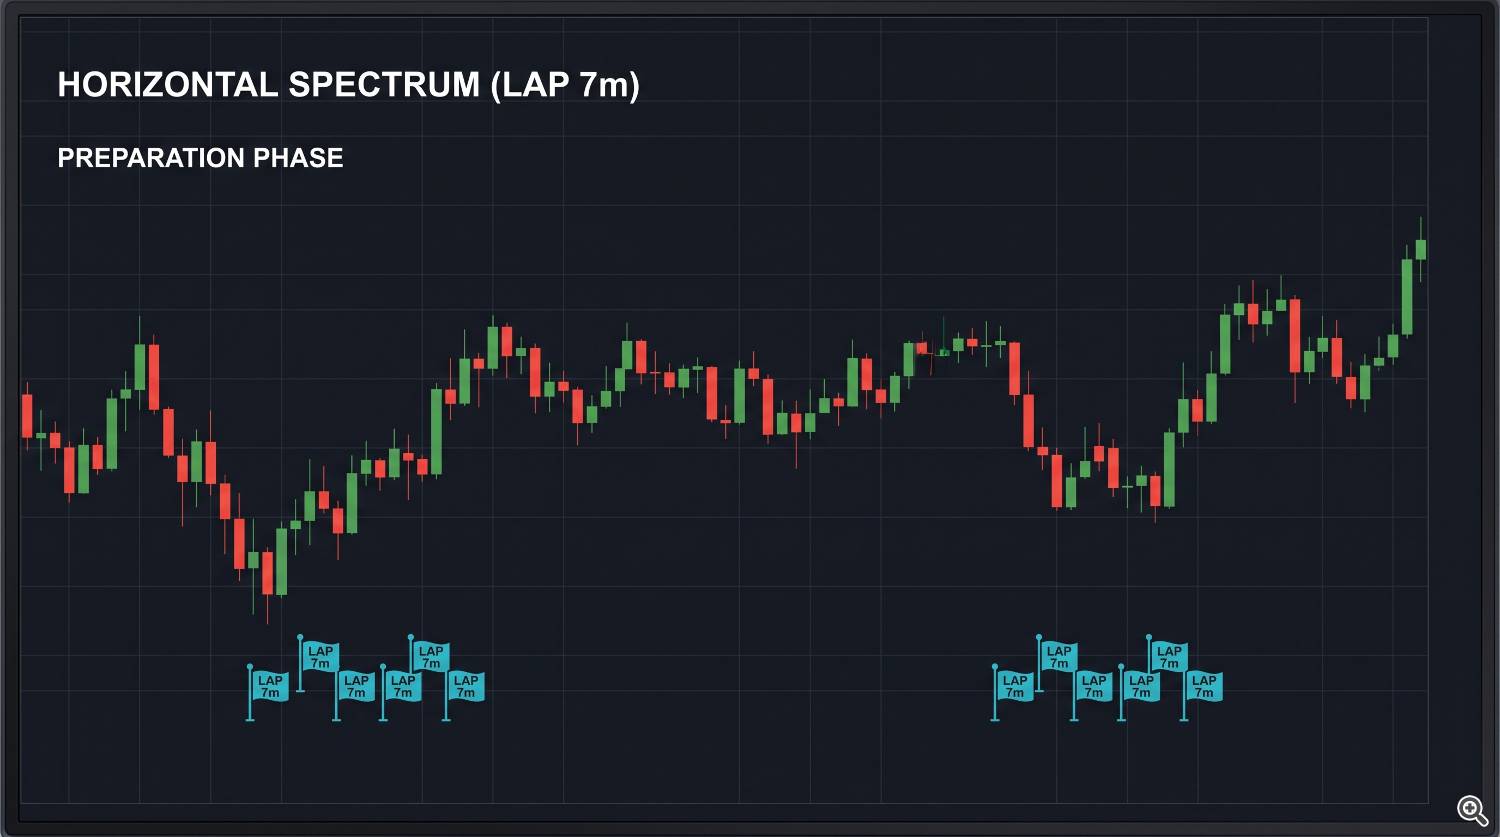
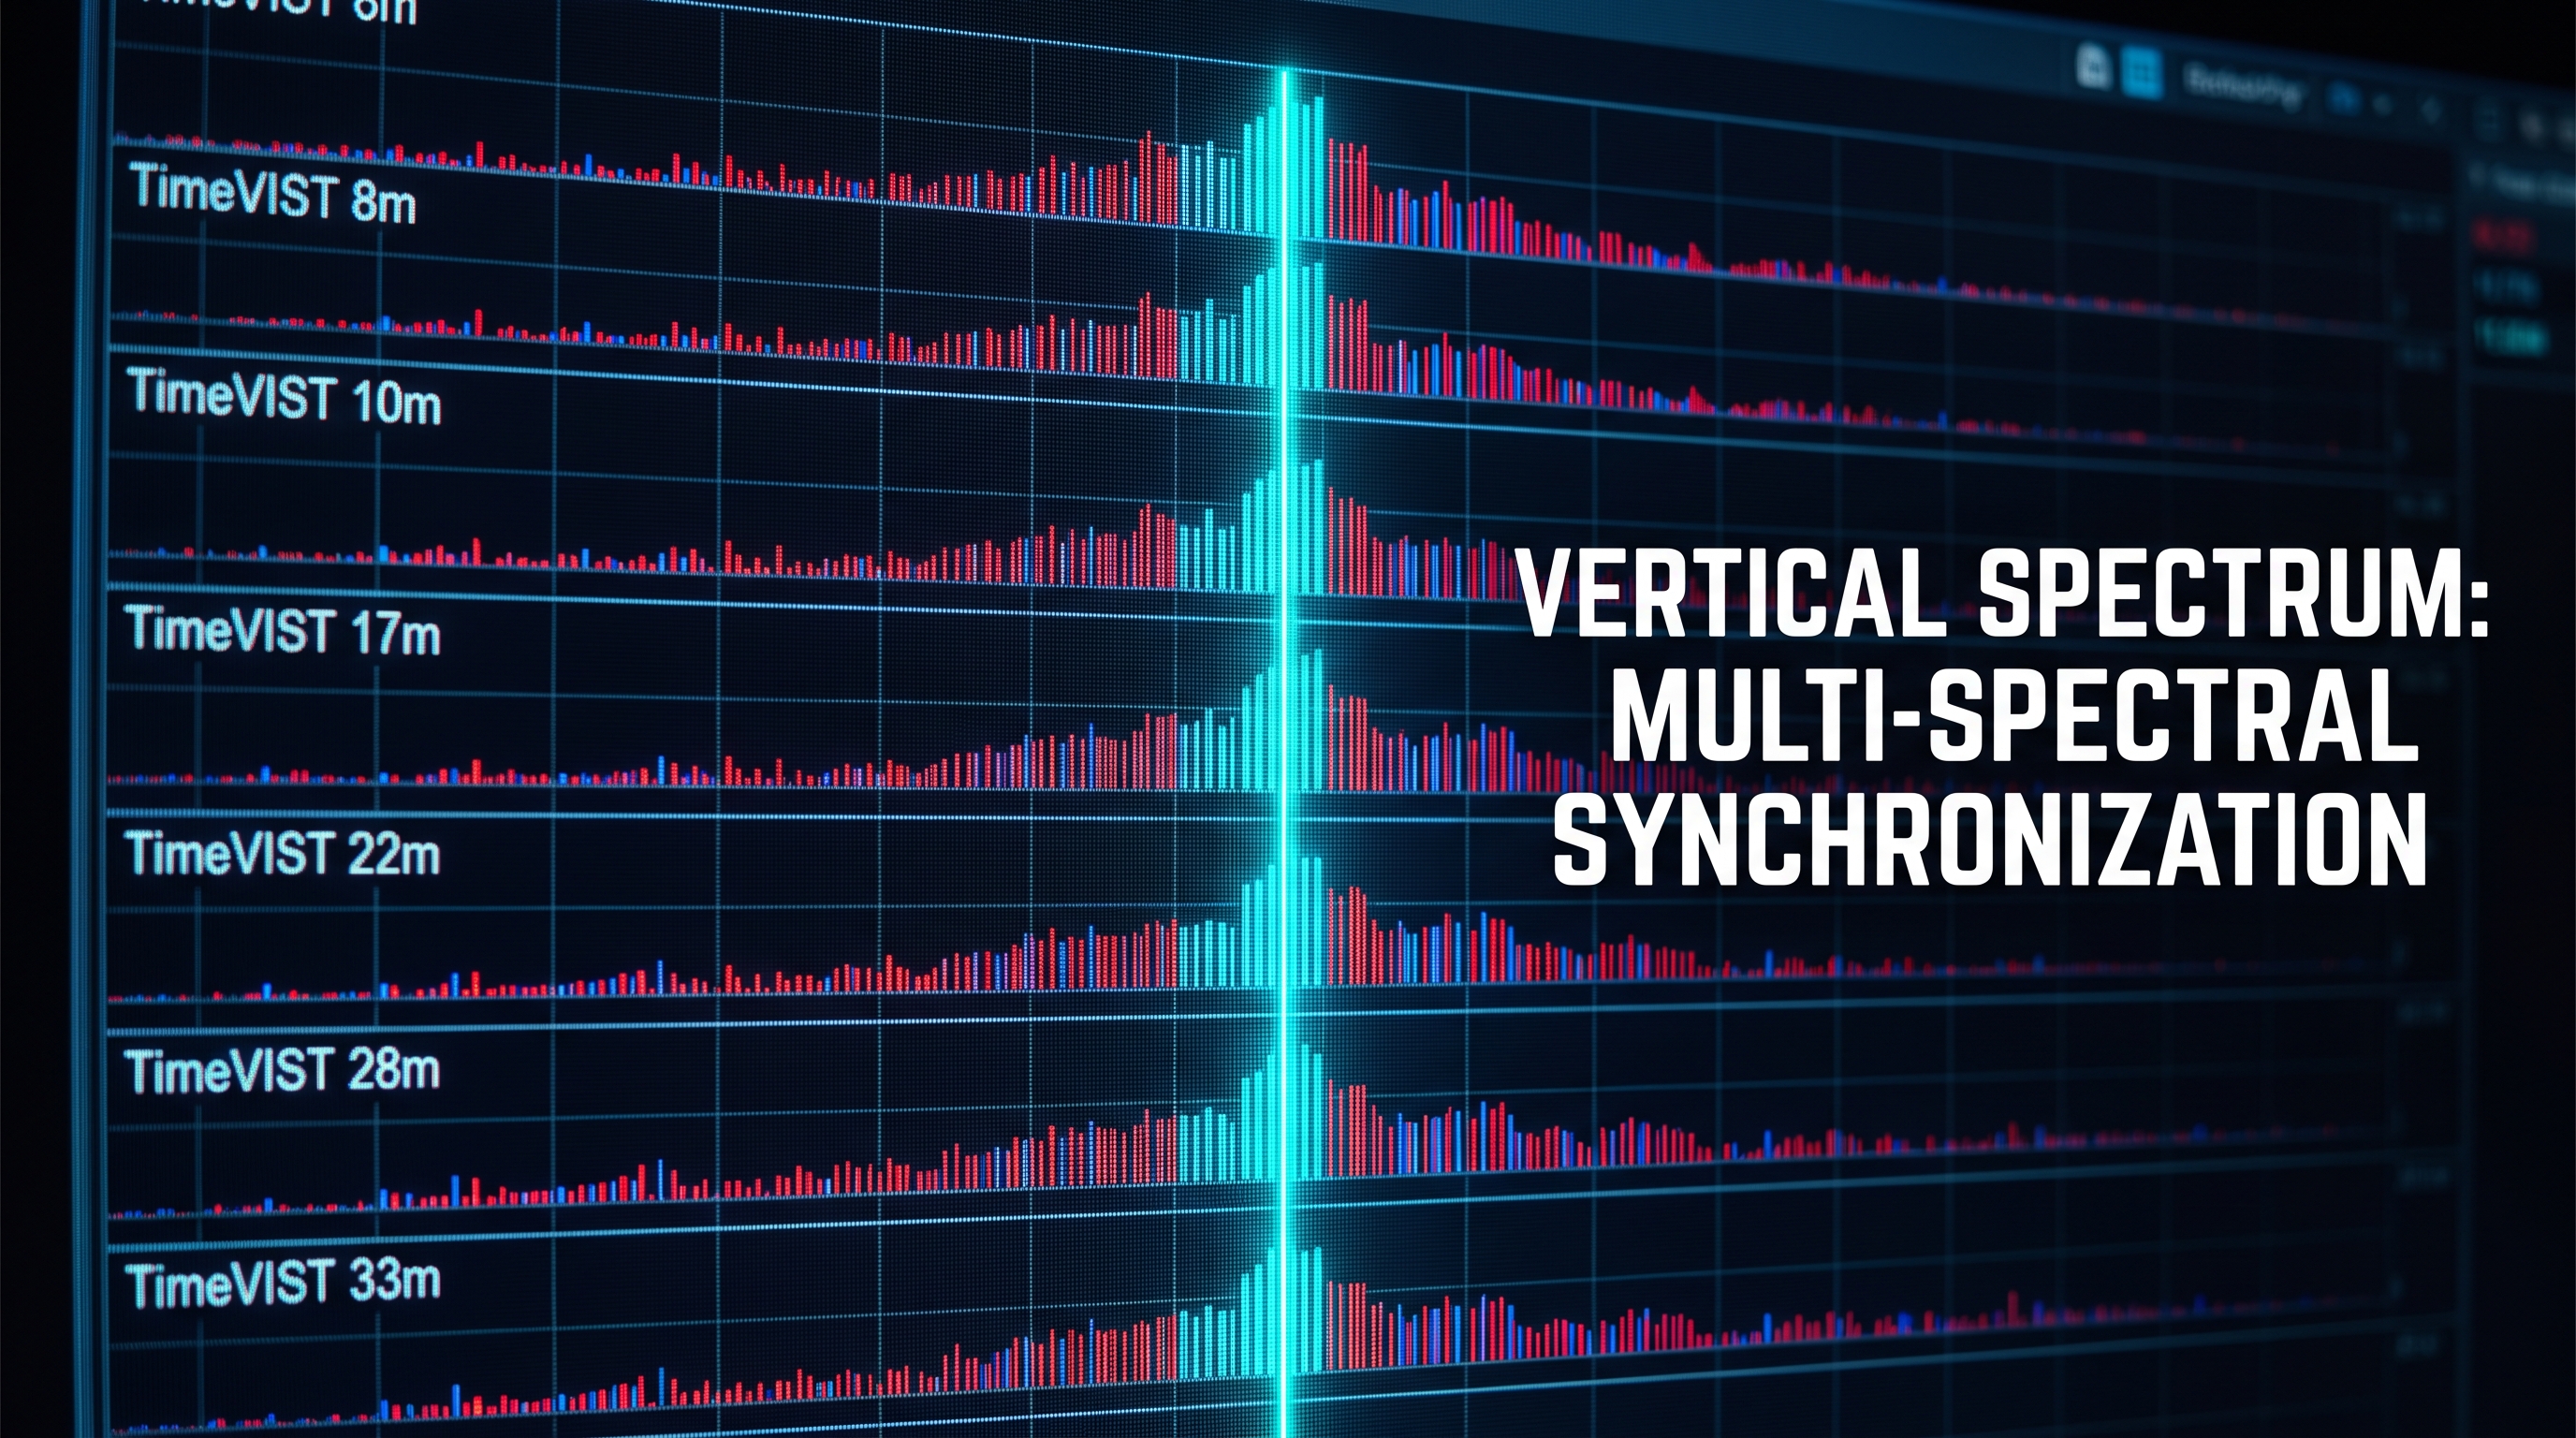
Horizontal Temporal Spectrum: The accumulation of single-timeframe signal density along the time axis, reflecting structural formation and energy accumulation phases.
-
-
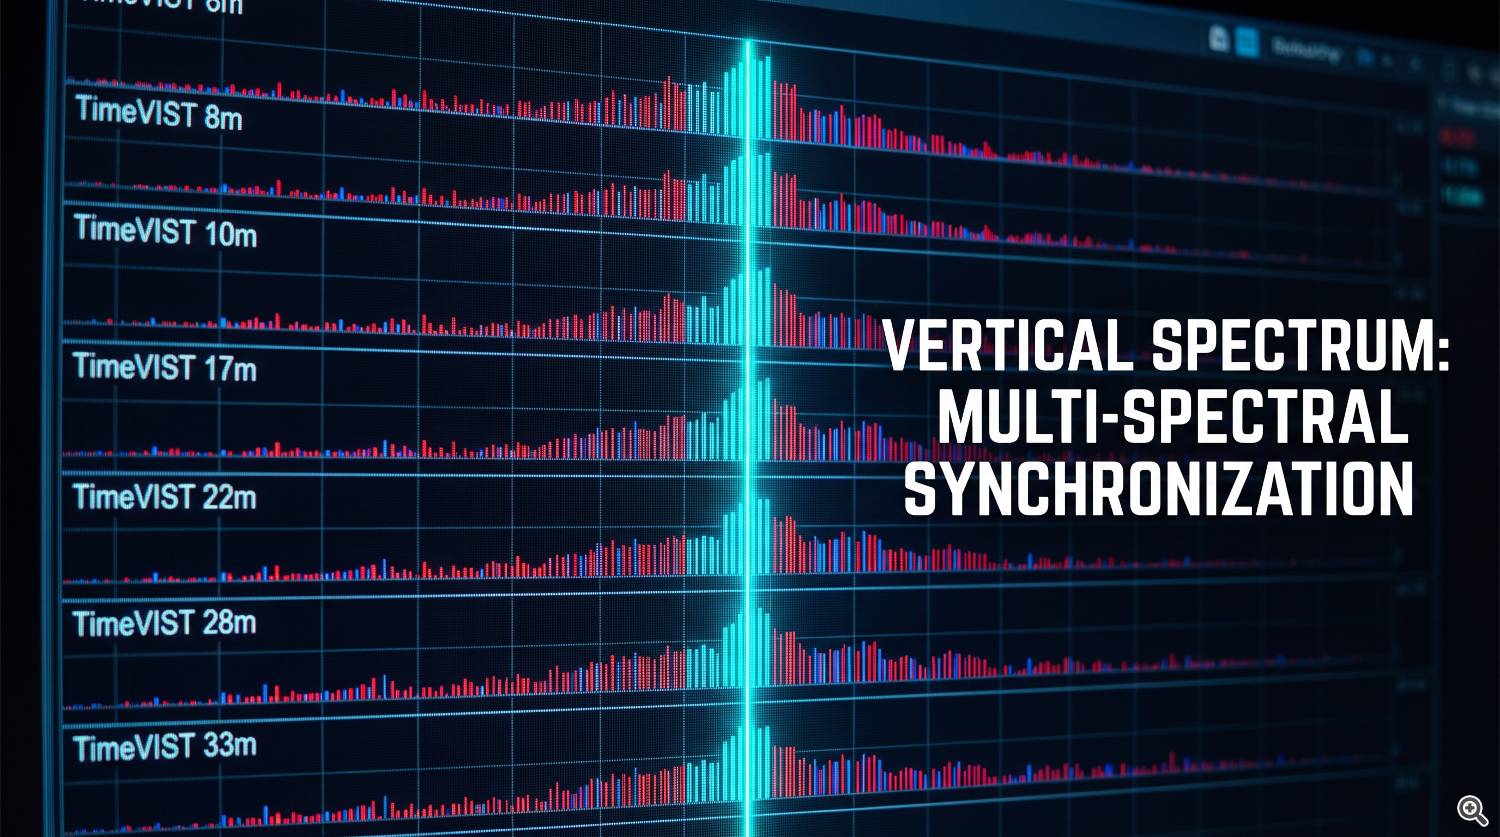
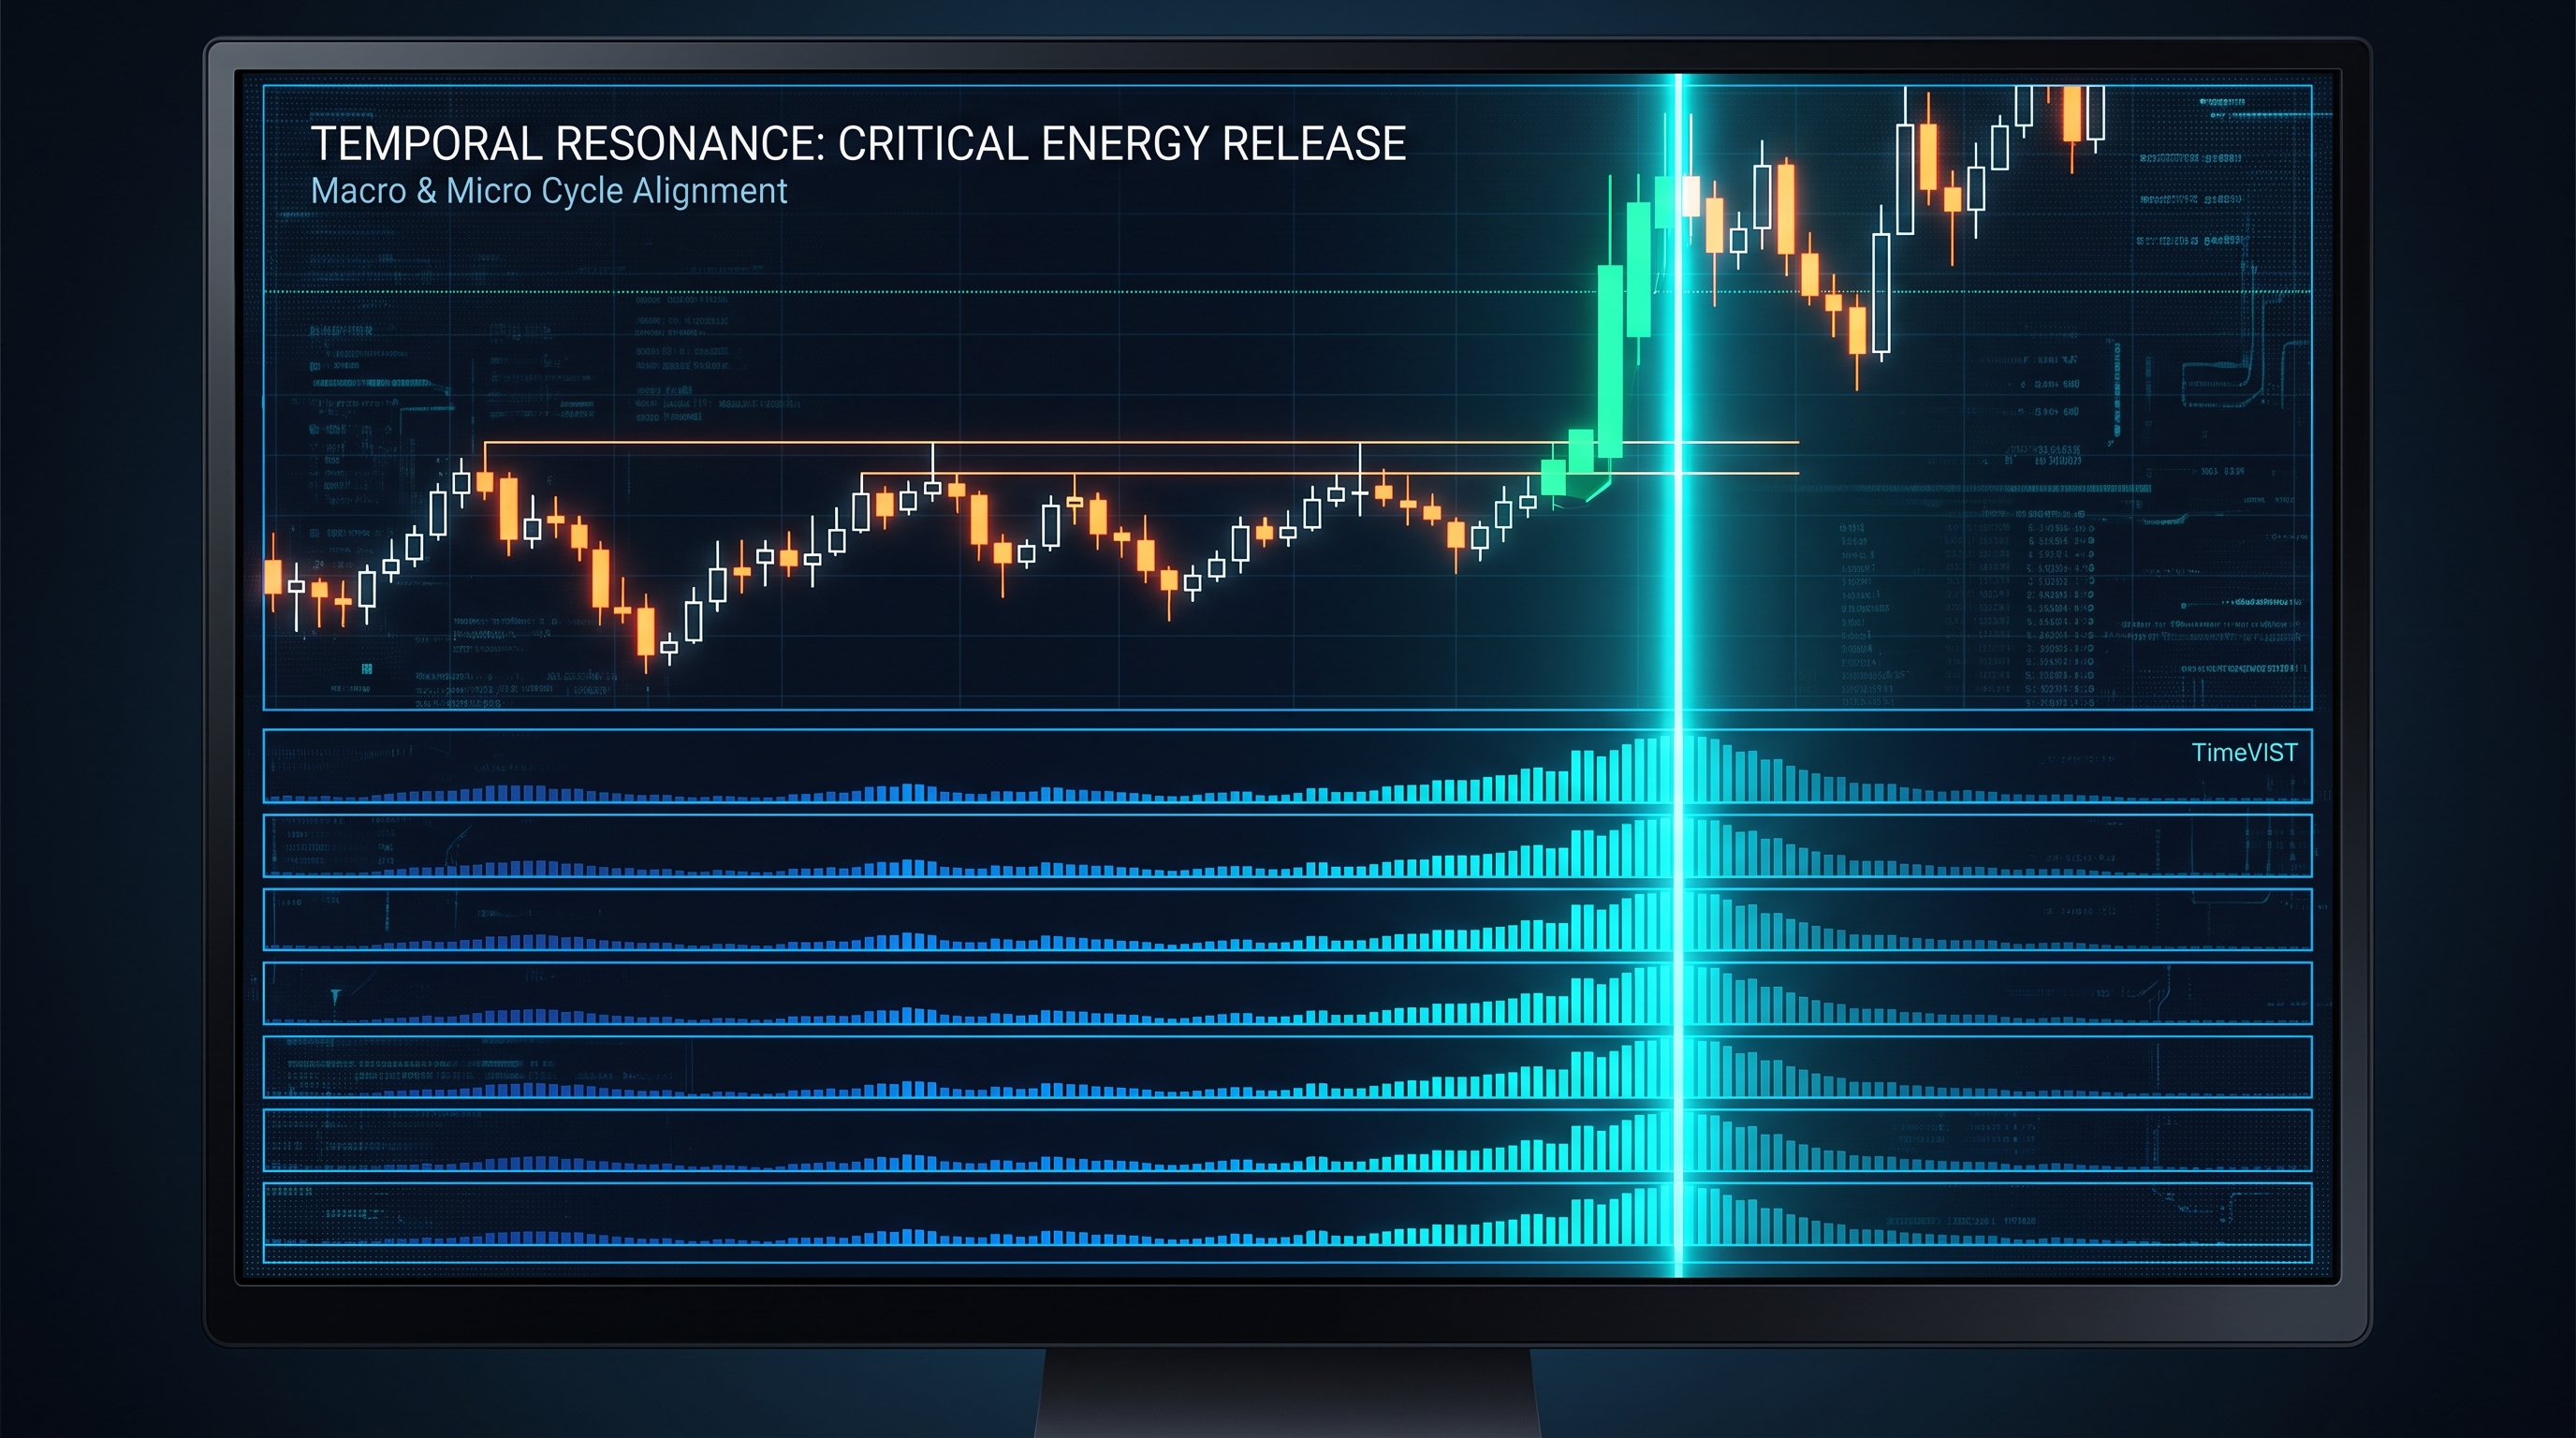
Vertical Temporal Spectrum: The alignment of timings across multiple timeframes at a single coordinate, creating conditions for high-probability directional trend impulses.
-
-
Temporal Spectrum vs Temporal Density: The distinction between the chronological length of a spectrum and its localized signal concentration, which dictates the strength of the market's probabilistic response.
-
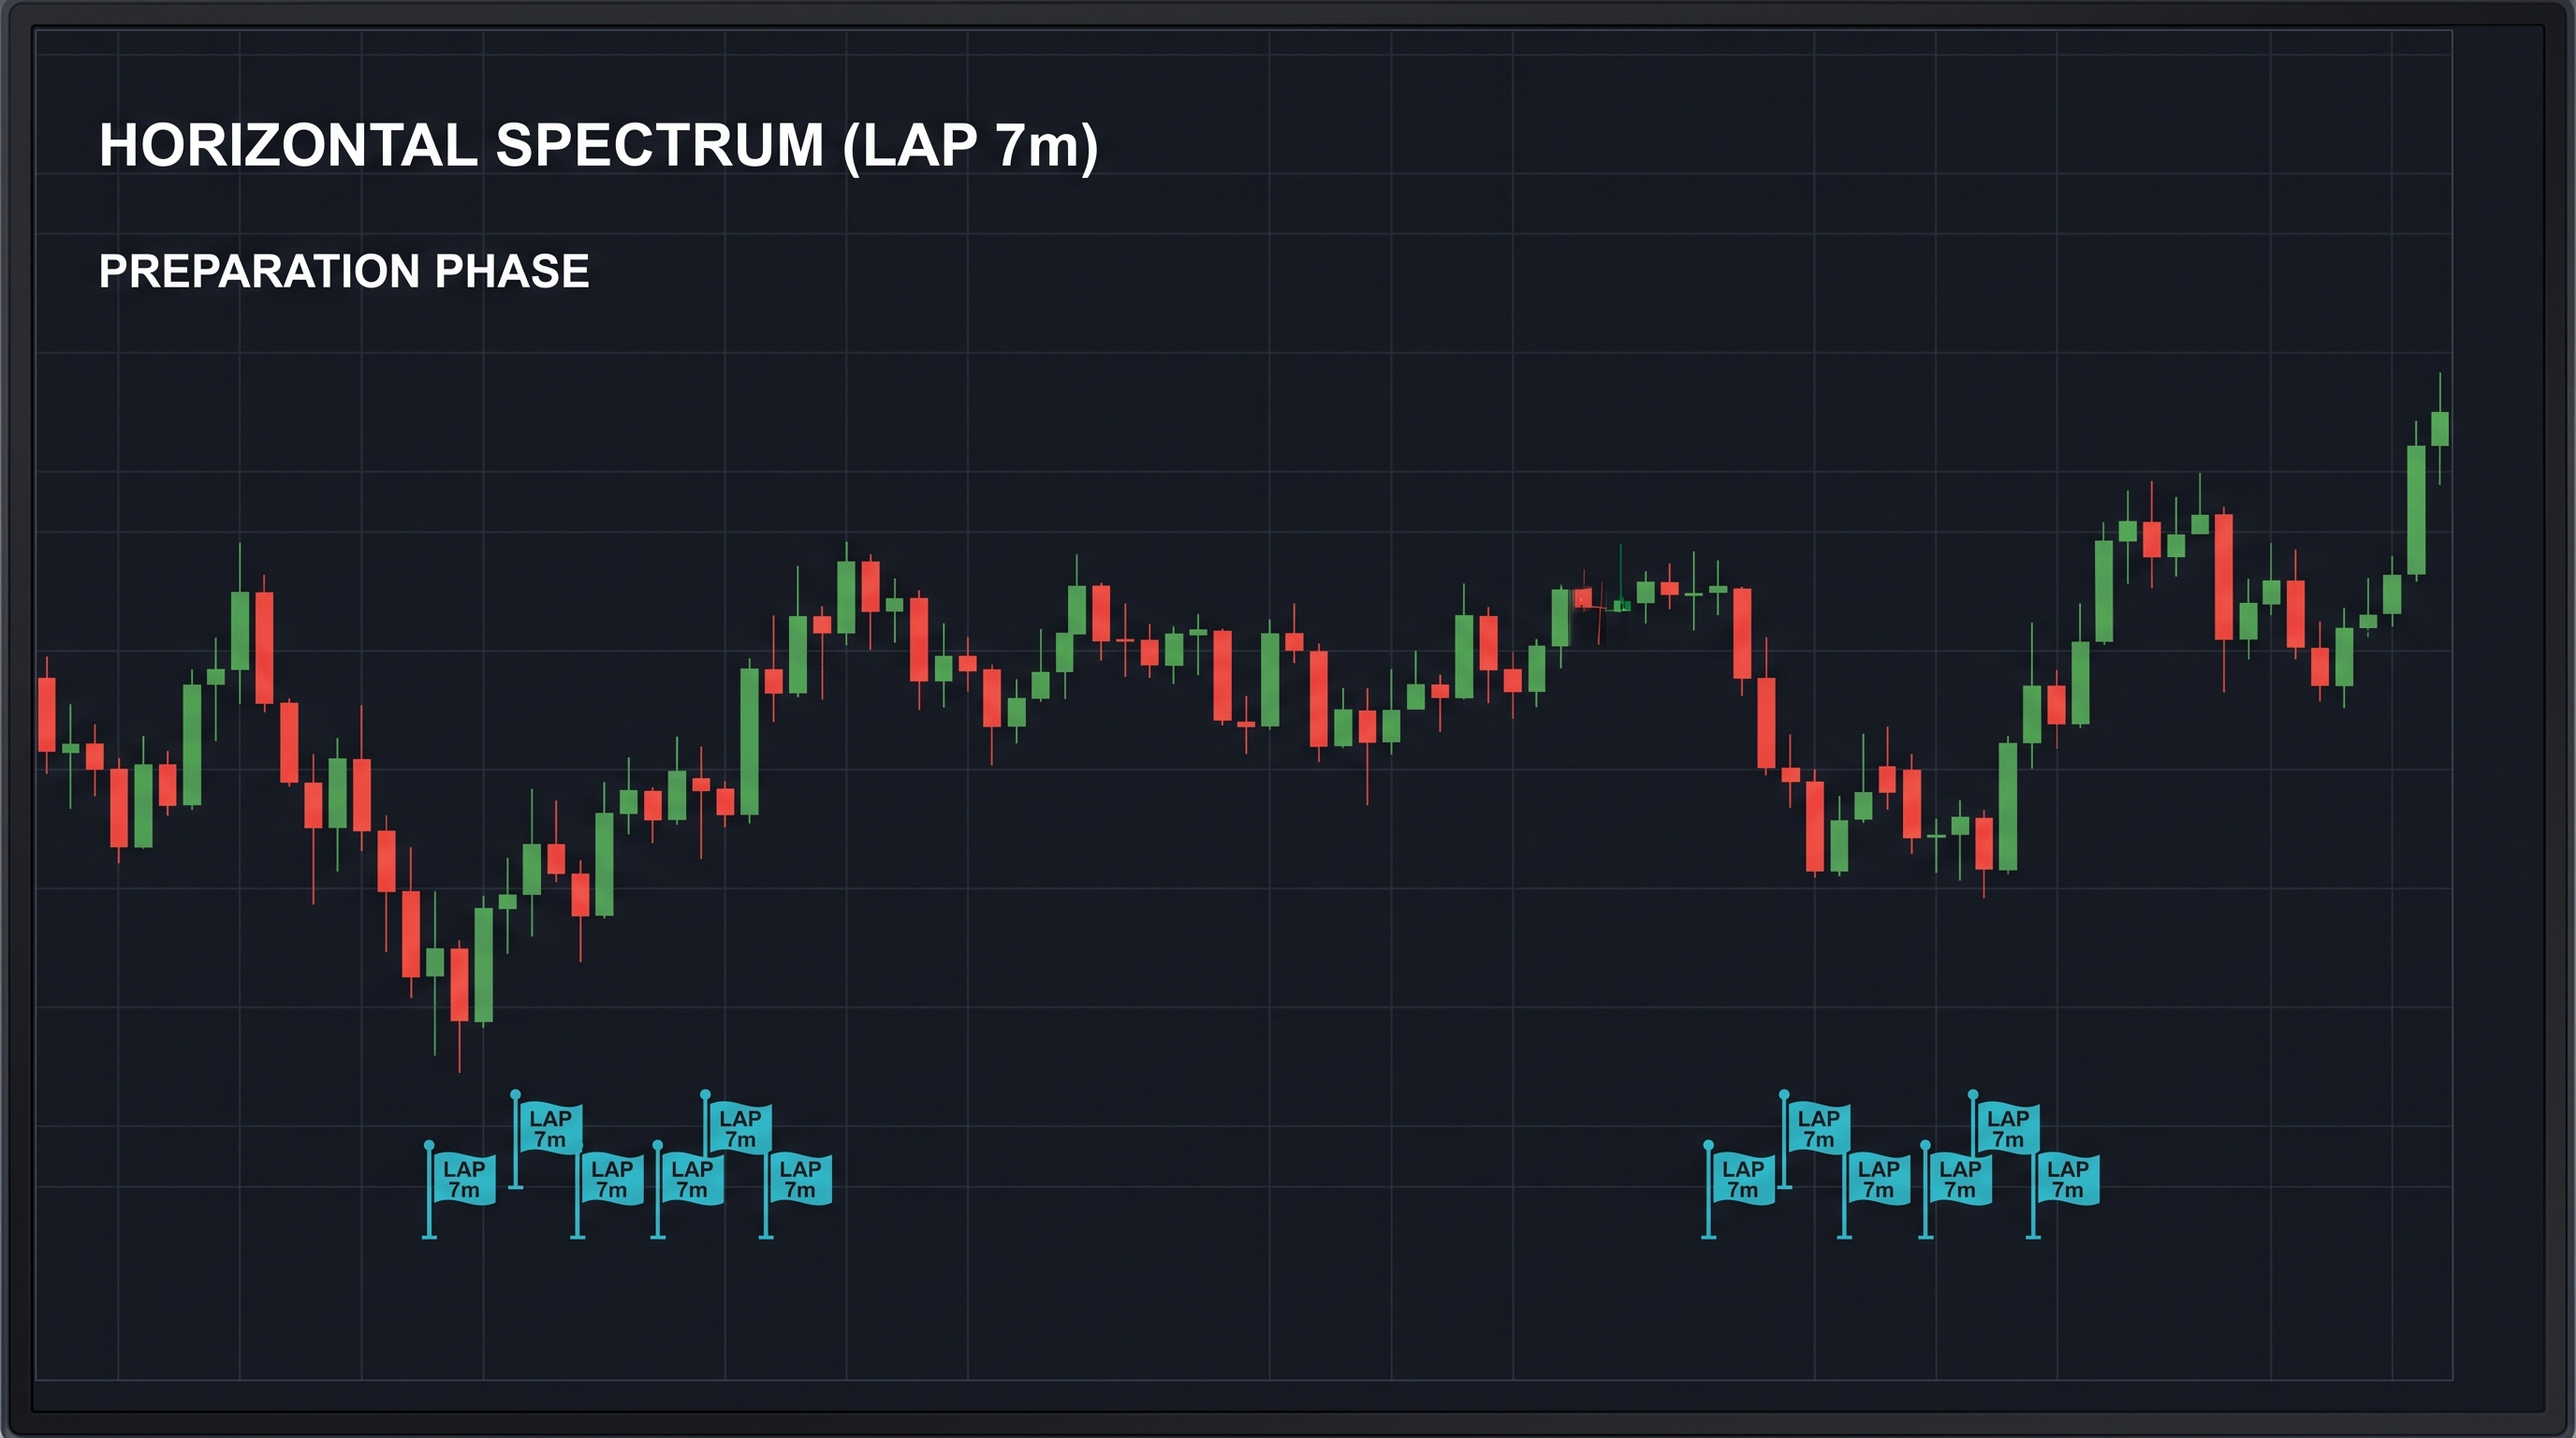
Combined Horizontal–Vertical Temporal Spectrum: A complex temporal architecture formed by the intersection of horizontal density accumulation and vertical multi-cycle synchronization.
2. How to Begin Working with the Laboratory
-
Step 1. Select a Financial Instrument: Start with an asset whose structural behavior you wish to study, such as Gold (XAUUSD), major currency pairs, or stock indices.
-
Step 2. Choose the LAP Time Horizon: VISTLAB offers timings across various cycle lengths. Compare different horizons to understand how interval scale correlates with observed price volatility and movement amplitude.
-
Step 3. Analyze Upcoming Timings: Examine the projected time, direction, and expected amplitude. Analyze the sequence of incoming timings, check vector alignment, and determine whether a Horizontal Temporal Spectrum or a Vertical Temporal Spectrum is forming.
-
Step 4. Map Timings to the Chart: Observe price dynamics leading up to the activation window, the immediate market reaction within the calculated timeframe, and the subsequent structural evolution. Account for prior price action and upcoming temporal coordinates.
-
Step 5. Transition from Observation to Scenario Building: Formulate a structured trading scenario prior to window activation. Define your expected direction, entry conditions, and invalidation criteria. Compare your forward projections against empirical results to build practical experience.
3. How to Interpret Timings
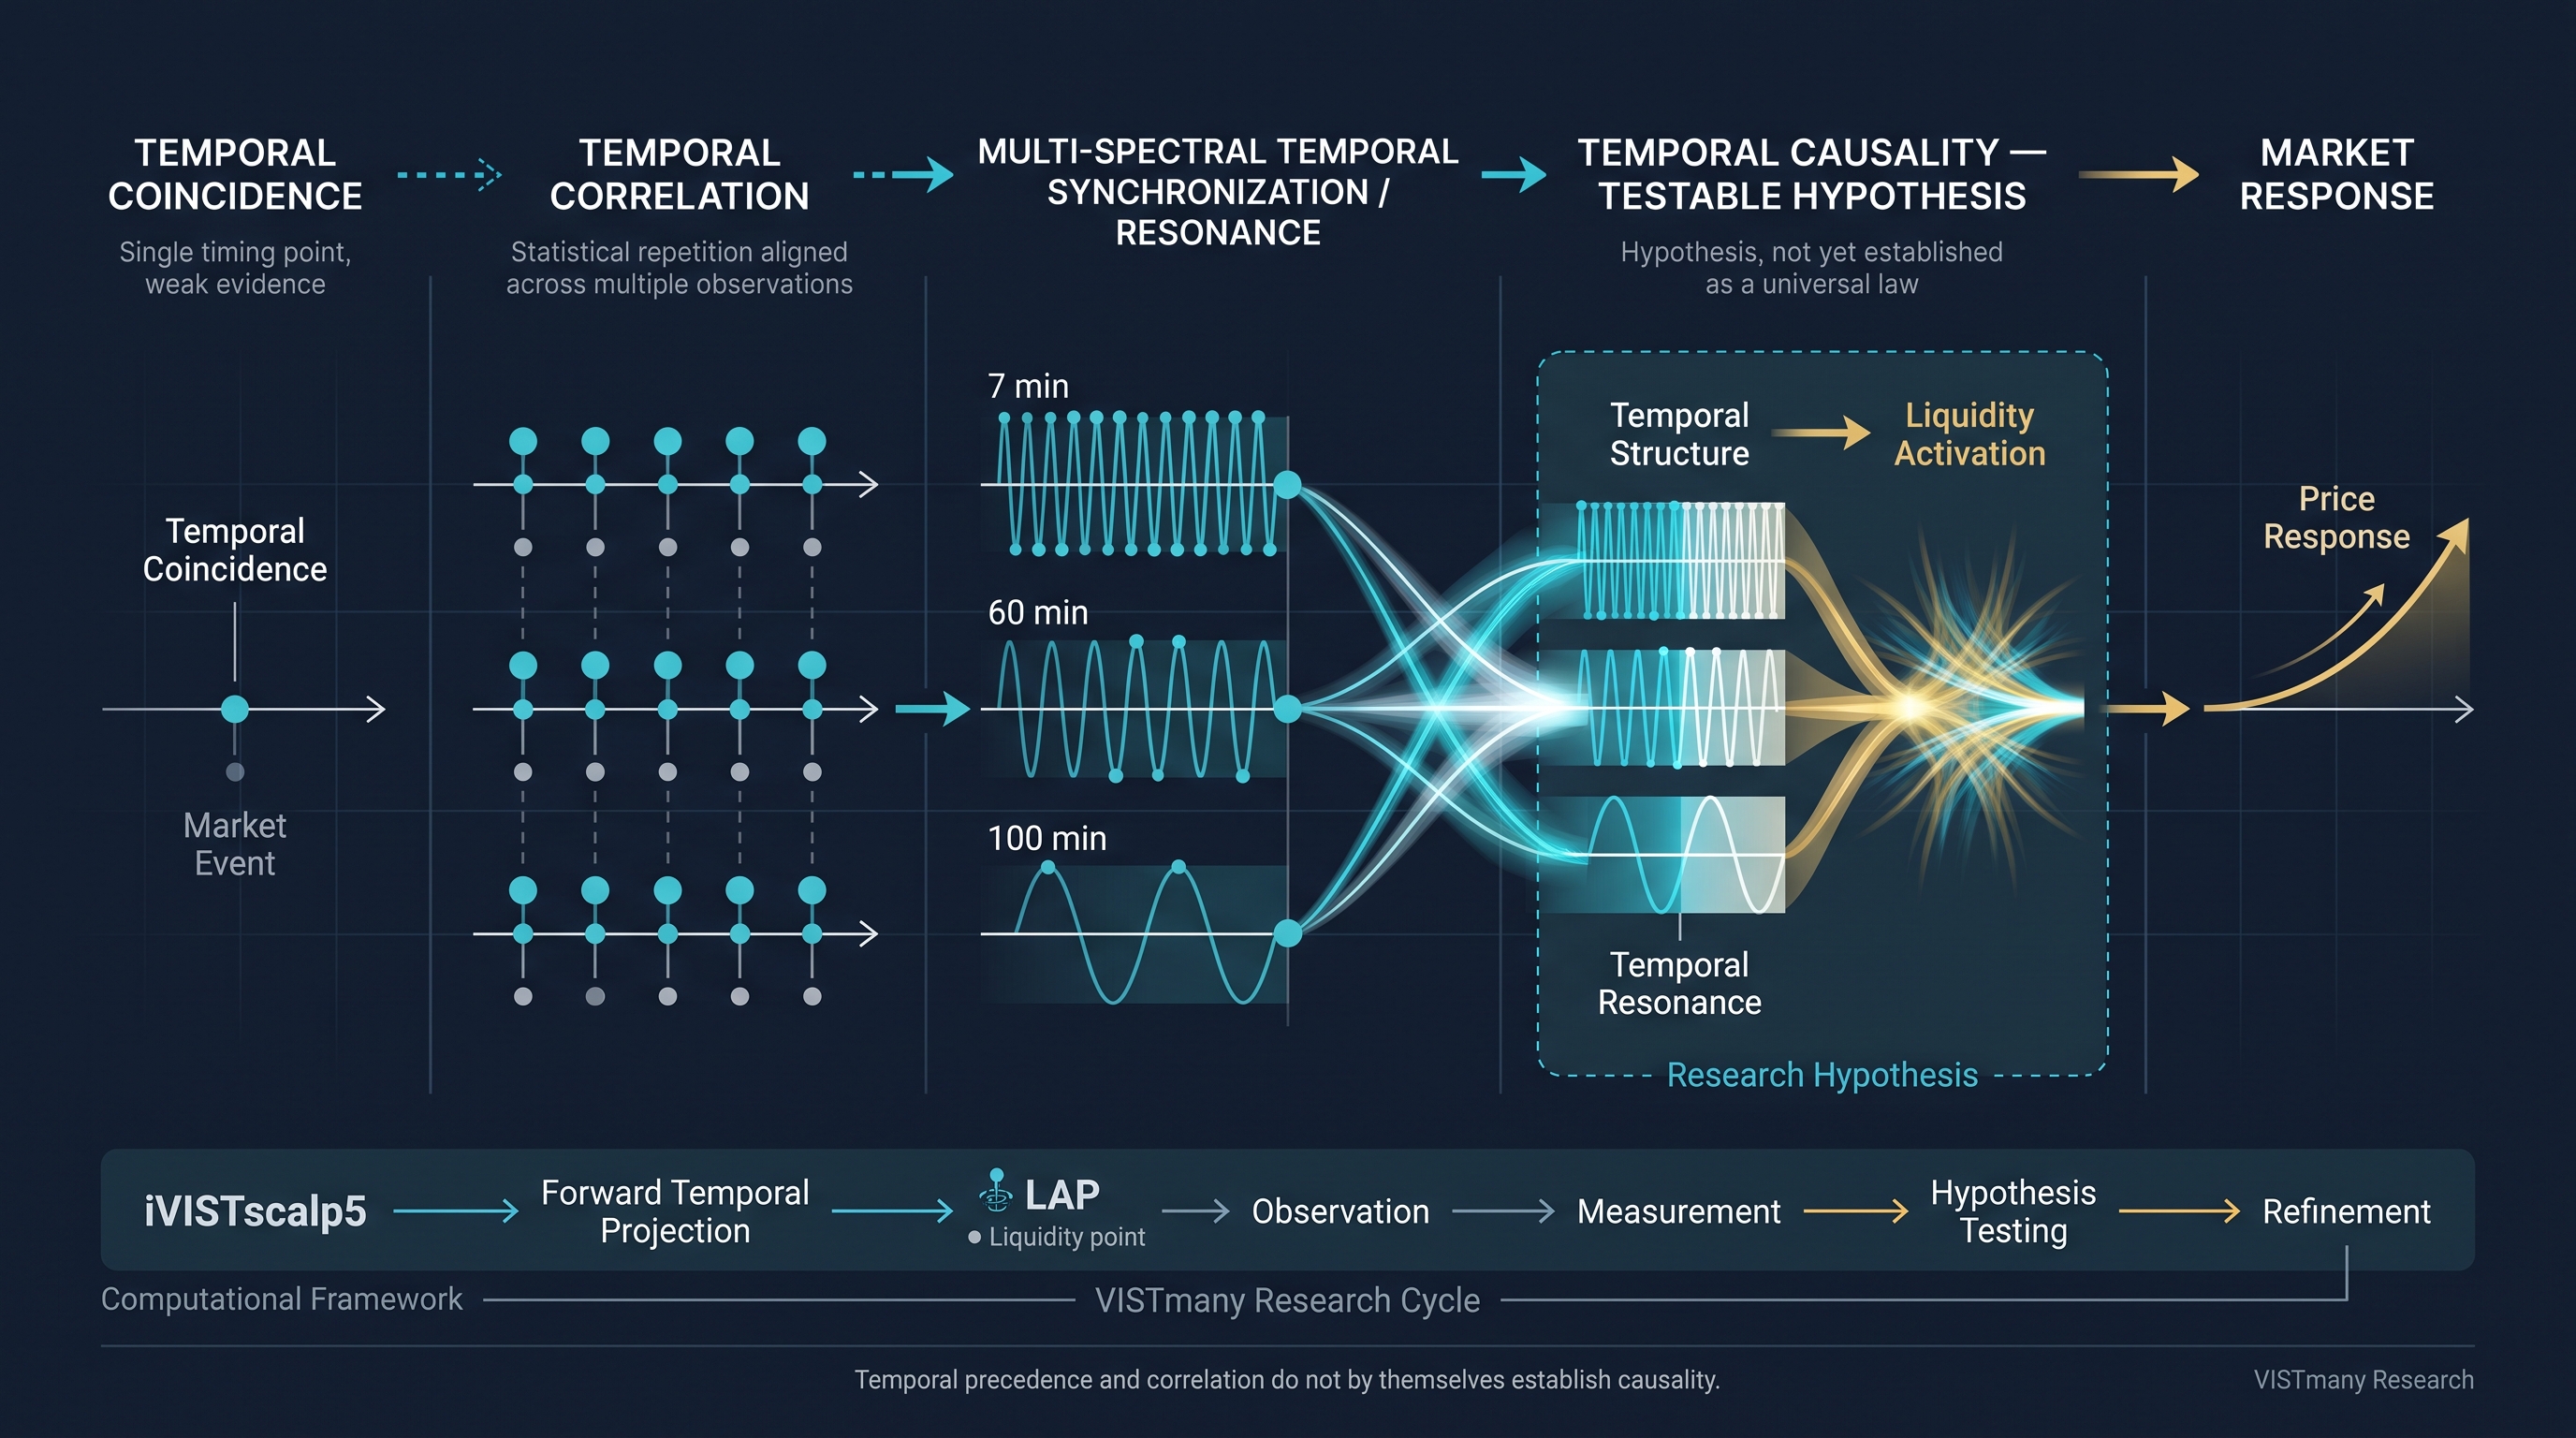
A LAP timing is not a static marker on a chart; its practical utility unfolds through temporal context and Price Action confirmation.
Pay close attention to key analytical criteria:
-
Timing Sequences: Evaluate consecutive temporal coordinates and how their calculated directional vectors interact.
-
Preceding Price Velocity: Observe how identical timings behave across different market states, such as following strong directional momentum versus tight consolidation.
-
Multi-Scale Confluence: Study price behavior during a Combined Horizontal–Vertical Temporal Spectrum, where micro and macro cycles converge.
-
Empirical Market Response: Look beyond the initial tick reaction at activation. Monitor price expansion over the entire TimeLife window of the structure.
-
Pattern Reproducibility: Compare structural behavior across multiple trading sessions to verify pattern consistency on new datasets.
4. Moving from Analysis to Execution
The primary objective of the VISTmany framework is to convert temporal forecasts into structured, disciplined trading decisions:
-
Identify critical temporal coordinates on the chart.
-
Deconstruct the calculated LAP direction and projected range.
-
Evaluate the Temporal Spectrum vs Temporal Density relationship in the current market phase.
-
Formulate precise BUY or SELL trade scenarios.
-
Define entry parameters, exit points, and explicit invalidation criteria.
-
Review execution outcomes to optimize trading discipline.
Core Rule: A timing organizes analysis through time, but final execution relies on price confirmation. A calculated BUY or SELL direction is not an automatic order trigger.
5. Practice Builds Understanding
Theoretical knowledge matures through systematic practice, continuous testing, and empirical evaluation.
Use VISTLAB for regular quantitative research. Re-examine prior trade setups, test your conclusions on new market data, and build an analytical framework rooted in practical experience.
For deeper research, you can utilize historical datasets, the MetaTrader 5 Strategy Tester, and the VISTmany trade archive:
-
Web version of the iVISTscalp5 framework (VISTLAB on our website): Calculates forward timing coordinates projected 1 day in advance.
-
iVISTscalp5 Indicator for MetaTrader 5: Provides full macro forecasting projected up to 1 week in advance, enabling multi-timeframe structural analysis.
6. Risk Awareness and Model Boundaries
Professional trading requires time, disciplined practice, and a grounded understanding of market uncertainty.
As analytical experience grows, traders gain clarity on:
-
Why a specific trade scenario is selected.
-
Which market conditions invalidate their hypothesis.
-
Where the physical applicability of the timing model ends.
Risk management stems not from fear of the market, but from a clear understanding of price mechanics, temporal coordinates, and execution discipline. Historical performance does not guarantee future market behavior. Exhaustive testing on historical data and within simulated MT5 environments is essential before deploying real capital.
7. Your Trajectory Is Self-Directed
VISTLAB provides the methodology and tools to analyze markets through a temporal dimension.
You can begin with basic timing analysis, progress to evaluating complex temporal spectra, and master the practical application of forward forecasts in live trading.
Whether your goal is quantitative cycle research, Gold (XAUUSD) scalping, or integrating LAP timing models into existing trading strategies, your trajectory depends on your commitment to learning.
VISTmany provides the paradigm to decode financial markets not merely across price, but across time.
Study the timings. Develop your understanding. Master the practice.
Original publication: VISTmany Official Website.
This article was originally published on the official VISTmany website and is republished here for informational and research purposes.
Original source: https://vistmany.com/vistlab
Official resources
• VISTmany website: https://vistmany.com/vistlab
• iVISTscalp5 on the MQL5 Market: https://www.mql5.com/en/market/product/70310
• Official VISTmany YouTube channel: https://www.youtube.com/@vistmany557
https://rosy440.substack.com/p/the-edge-of-restraint-why-you-shouldnt
© VISTmany Research Journal
Exploring the architecture of Temporal Space in financial markets.
The VISTmany research archive includes more than 900 publicly documented trading examples based on timing forecasts published in advance.
These examples provide a practical record for studying how forecasted temporal structures correspond to subsequent market behavior.
YouTube - VISTmany Scientific Research