[iVISTscalp5 indicator]: Knowing Which LAPs to Filter in Market Analysis

iVISTscalp5 indicator: Knowing Which LAPs to Filter in Market Analysis
Strategic foresight is the hallmark of a professional trader. The iVISTscalp5 indicator empowers this by projecting LAPs (Liquidity Activation Points) for any financial asset in MetaTrader 5 up to a full week in advance. While this provides a forward-looking roadmap of potential volatility, direction, and amplitude, having a temporal forecast does not mean you must blindly execute every generated timing.
True trading mastery lies in knowing when to act, when to wait for price confirmation, and when to step aside entirely. Within the VISTmany methodology, a timing is a designated window for observation—not an absolute guarantee of a straight-line market move. This is precisely why intelligent filtration is the cornerstone of the TLV (Time Language VISTmany) framework.
Here are the definitive rules for filtering LAPs in your daily analysis:
1. The Core Principle: Selective Trading Novices often treat a BUY or SELL LAP as a strict execution command. The market's reality is far more nuanced. An identical LAP can manifest at the birth of a trend, during its continuation, or right at the point of exhaustion.The TLV Golden Rule: Evaluate the structural context first, wait for the price's reaction second, and only then make a trading decision. "Ignoring" a timing simply means refusing to use it as the sole justification for a trade when it lacks structural backing.
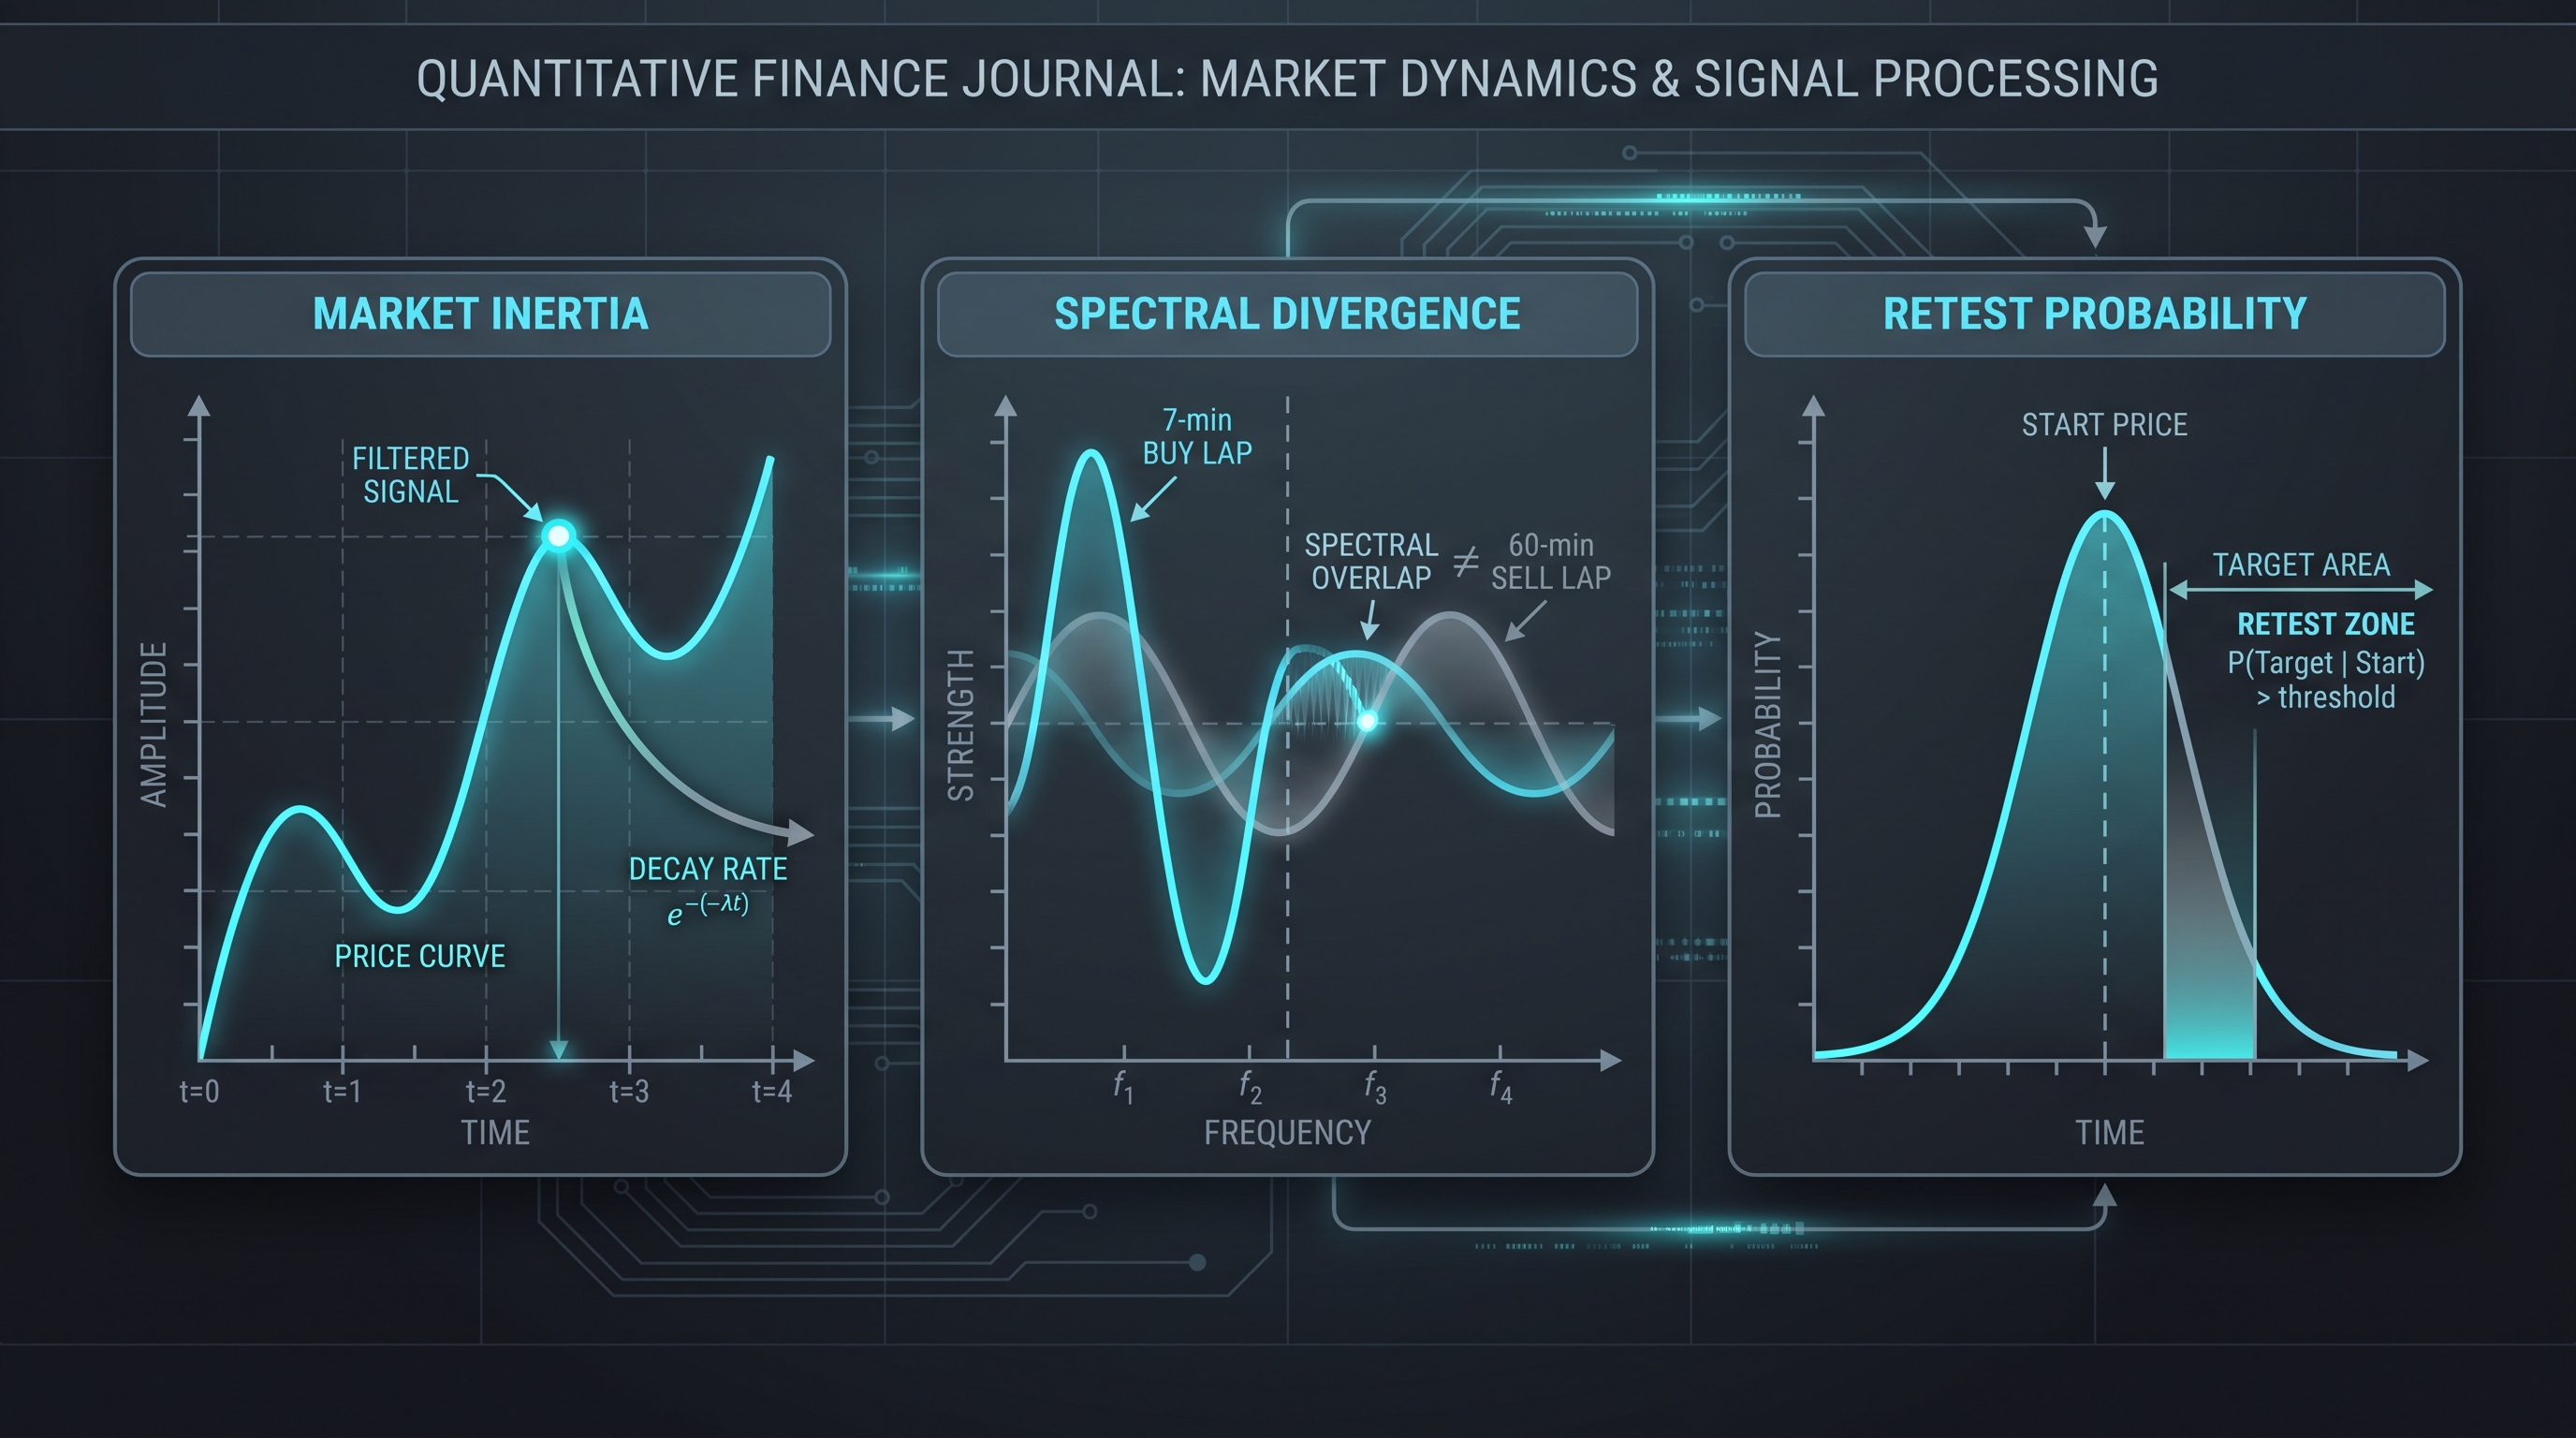
2. Beware of Inertia (Filtering Late SELLs) If the market has already plummeted, breaking daily lows with heavy bearish momentum, a freshly generated SELL LAP might be a trap. Entering a short position here often leads straight into a false breakdown, a deep correction, or a sharp reversal. Before jumping in, assess the distance the price has already traveled, look for upcoming counter-LAPs, and observe how the price interacts with nearby liquidity zones. Even a brief downward spike after the LAP activates might just be a final stop-hunt before a trend change.
3. The Inverse Logic (Filtering Late BUYs) The same principle applies to powerful uptrends. If the asset has surged to a daily high, buying on a new BUY LAP without contextual confirmation is an unjustified risk. Ensure the market has actual strength remaining and is holding structural support (such as the p(p) level) rather than blindly buying at historical extremes.
4. Daily Extremes Are High-Risk Zones Daily highs and lows demand multiplied analytical focus. Do not automatically buy at the high just because a BUY signal appears, and do not auto-sell at the low. In the TLV framework, your objective is not to pick tops and bottoms. Your goal is to observe if the market possesses sufficient energy to break the extreme exactly at the moment of LAP activation.

5. Look Ahead on the Temporal Horizon Never analyze a LAP in isolation. Always scan the temporal structure to the right of the chart. A SELL timing might yield only a shallow pullback if the algorithm has calculated a massive BUY structure just a few minutes later. Opposing timings act as natural amplitude limiters. Pay special attention to Momentum Clusters and vertical synchronization—the closer an opposing LAP is, the stricter your entry criteria should be.
6. The Illusion of Length: Horizontal vs. Vertical Power A long, dense string of LAPs on the same timeframe might look reliable, but horizontal density alone doesn't guarantee an explosive move. VISTmany’s quantitative research on XAUUSD M1 (2020–2026) reveals that long horizontal spectra often represent prolonged accumulation phases.The Amplitude Rule: True directional energy is achieved through vertical synchronization—the alignment of both micro and macro timings at the exact same temporal coordinate.

7. Resolving Macro/Micro Divergence Cycle hierarchy is essential. If a micro BUY LAP appears while the dominant higher-timeframe structure is heavily bearish, a temporal conflict arises. VISTmany data shows these divergent zones produce choppy, erratic price action with deep drawdowns. The higher timeframe usually suppresses the amplitude of the lower cycle. Skipping these divergent setups without rock-solid confirmation is a true sign of professionalism.
8. Macroeconomic News Disrupts Standard Cycles Major fundamental releases (FOMC, CPI, NFP) temporarily shatter the market's standard temporal flow. If a LAP aligns with top-tier news, expect chaotic and bidirectional volatility. The timing isn't "wrong," but the fundamental shock overrides technical algorithms. Trade these periods with surgical caution, or avoid them altogether.
9. TimeLife Expiry Does Not Equal a ReversalTimeLife denotes the active lifespan of a timing. When this window closes, it does not mean the market is obligated to instantly reverse. VISTmany data firmly indicates that TimeLife expiration should never be used as an independent signal to open counter-trend positions. Focus solely on actual price retention and upcoming active spectra.
10. Invalidation via Adverse Excursion If the price moves aggressively against your LAP by a distance equal to the timing's own projected range, the setup requires immediate reassessment. Based on XAUUSD M1 datasets, full price recoveries and target achievements following deep adverse excursions within the remaining TimeLife happen only 10–15% of the time. Do not average down on losing trades hoping for "temporal magic."
11. Temporal Voids Are Not Forecasts A gap on the chart with no upcoming LAPs is a temporal vacuum. It predicts neither a reversal nor a trend continuation. Do not try to guess the market direction during these voids; rely solely on the residual TimeLife periods of preceding structures.
12. Contextualize the Days of the Week While VISTmany research confirms that certain days and trading weeks of the month (especially the 2nd and 3rd) exhibit distinct volatility profiles, a day of the week is never an absolute prohibition on trading. Calendar context is highly valuable, but live price action always takes precedence.
13. The Magnetism of the Start Price Statistically, following LAP activation, the price returns to its inception level (the Start Price) with a 71–81% probability. This makes it a powerful liquidity magnet. However, this return should be viewed as an area for careful reaction analysis (a retest), not an excuse to place automatic limit orders.
14. The TLV Pre-Trade Checklist Before entering the market, ask yourself three critical questions:
Context: Is the momentum already exhausted? Am I buying the top or selling the bottom?
Horizon: Are there conflicting LAPs directly ahead? Is vertical synchronization working against me?
Reaction: Has the actual price action confirmed the temporal forecast?
15. Validate Filtration via MT5 Because the iVISTscalp5 architecture calculates timings a week in advance, you can utilize the MetaTrader 5 Strategy Tester to backtest these filtration rules on historical data without curve-fitting. The ultimate question during testing is: does this specific filter genuinely improve the quality of my scenario selection when accounting for spread and slippage?
Conclusion: Strong Analysis Begins with the Right Rejections In the VISTmany philosophy, success isn't about taking every single trade the algorithm presents; it's about extracting profit from high-probability temporal anomalies. The algorithm highlights the when. Your comprehension of the price context and your discipline accomplish the rest.
Sometimes, the most profitable trade is the one you rightfully chose to ignore.
**************************************************************
Original publication: VISTmany Official Website.
This article was originally published on the official VISTmany website and is republished here for informational and research purposes.
Original source: https://vistmany.com/school#6
• VISTmany website: https://vistmany.com/vistlab
• iVISTscalp5 on the MQL5 Market: https://www.mql5.com/en/market/product/70310
• Official VISTmany YouTube channel: https://www.youtube.com/@vistmany557
© VISTmany Research Journal
Exploring the architecture of Temporal Space in financial markets.
The VISTmany research archive includes more than 900 publicly documented trading examples based on timing forecasts published in advance.
These examples provide a practical record for studying how forecasted temporal structures correspond to subsequent market behavior.
YouTube - VISTmany Scientific Research