246.3 Million Real Ticks, 34 Markets Researched, 23 Rejected, and a $117,000 Live Account Lesson: Inside the Engineering

246.3 Million Real Ticks, 34 Markets Researched, 23 Rejected, and a $117,000 Live Account Lesson: Inside the Engineering of AbacuQuant Portfolio
If you have spent enough years inside the MetaTrader 5 Strategy Tester, you already know the dirty secret of retail algorithmic trading: almost anyone can curve-fit a single currency pair on OHLC bars, and almost nobody survives multi-year real-tick execution across uncorrelated asset classes.
When we started building AbacuQuant Portfolio, we refused to build another grid, martingale, or "AI black box" that hides floating drawdown until Margin Call. Every single position had to obey three non-negotiable institutional rules from millisecond zero:
- 100% Physical Stop Loss & Take Profit sent with the order ( SL = sl_mult * ATR , TP = tp_mult * ATR ).
- Strict Time-Window Isolation & Maximum Holding Horizon (if a setup does not resolve within its structural session window, it is closed algorithmically).
- Zero Averaging, Zero Martingale, Zero Grid.
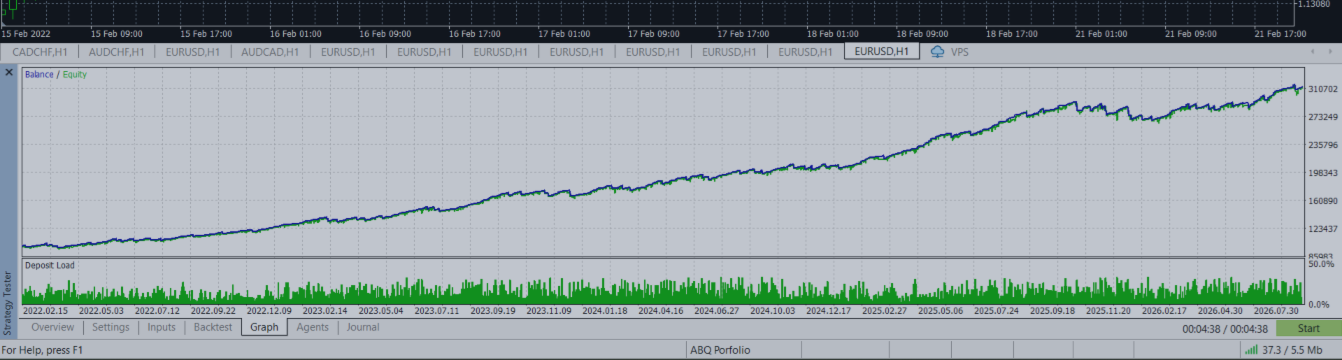
To find genuine microstructural edges, we built an automated discovery and validation pipeline across 34 global instruments (FX Majors, FX Crosses, US/European/Asian Equity Indices, Commodities, Energies, and 10 US Equities) using 100% Real Ticks (246,390,927 ticks from the Darwinex-Live server, 2020.01 – 2026.08) with variable spreads, real commissions, swaps, and simulated execution latency.
What we discovered challenged one of the most sacred dogmas in trading.
1. The "2:1 Risk-Reward" Fallacy vs. Microstructural Physics
Retail trading literature repeats endlessly that you should only trade setups with a Take Profit >= 2x Stop Loss ( RR >= 2:1 ).
We decided to test that dogma scientifically. We ran a dedicated multi-million-pass genetic optimization campaign across 22 liquid instruments forcing a strict structural constraint: tp_mult >= 2.0 * sl_mult , followed by three brutal admission gates on isolated 100% Real-Tick runs:
- Gate 1 (Stop Integrity): At least 95% of all losing trades must close at their physical Stop Loss (not premature timer exits that mask tail risk).
- Gate 2 (Statistical Edge over Break-Even): The observed Win Rate must exceed the theoretical break-even Win Rate ( WR_BE = SL / (SL + TP) ) by a Student's t-statistic of t >= 2.0 sigma in both the Selection Period (2020–2024) and the Validation Period (2024–2026).
- Gate 3 (Sample Sufficiency): At least 40 observed real-tick losses to eliminate small-sample luck.
The result of the RR >= 2:1 experiment?
Out of 22 markets, 21 failed. Only the Nasdaq-100 ( NDX ) had enough sustained intraday drift to pass all three gates with TP > 2x SL . In FX majors, crosses, gold, and European/Asian indices, forcing a wide 2:1 or 3:1 target on H1 meant price routinely reached +0.4x to +0.8x ATR in profit, mean-reverted inside normal session noise, and hit the Stop Loss.
When we instead allowed the optimizer to adapt to intraday microstructural reality—capturing high-probability impulse and mean-reversion bursts ( RR typically between 0.30:1 and 0.65:1 ) where the empirical Win Rate ( 76% – 85% ) sits 4 to 9 standard deviations ( t > 4.4 sigma ) above the break-even threshold—the math locked in across asset classes.
Out of 34 markets researched, 23 were ruthlessly discarded ( USDCAD , USDCHF , GBPJPY , NZDUSD , AUDJPY , FCHI40 , GDAXI , SPA35 , SP500 , XAGUSD , XTIUSD , XNGUSD , GBPUSD [pending sample size], and 10 US stocks).
Only 11 instruments passed every single real-tick filter:
- FX (4): EURUSD , USDJPY , AUDUSD , EURJPY
- Metals (1): XAUUSD
- US Indices (2): WS30 (Dow Jones), NDX (Nasdaq-100)
- European Indices (2): STOXX50E (Euro Stoxx 50), UK100 (FTSE 100)
- Asian/Pacific Indices (2): NI225 (Nikkei 225), AUS200 (ASX 200)
Combined into a single engine (71 independent strategy slots across 19 trigger families: RSI/Stoch Exits, Bollinger Rejects, Fibonacci Breakouts, Bearish/Bullish Imbalances, EMA/MACD Crosses, ADX Trends, Support/Resistance Rejects, and Inside Bars), the 11-asset portfolio delivered on 100% Real Ticks at 0.5% risk per trade ( $100,000 initial deposit):
| Metric (100% Real Ticks, Darwinex Server) | Selection (2020.01 – 2024.05) | Validation (2024.05 – 2026.08) |
|---|---|---|
| Total Closed Trades | 7,484 | 3,849 |
| Win Rate (%) | 80.76% | 79.48% (3,059 W / 790 L) |
| Profit Factor | 1.48 | 1.38 |
| Sharpe Ratio | 5.27 | 4.40 |
| Recovery Factor | 33.66 | 18.41 |
| Max Relative Equity Drawdown | 6.41% | 6.34% (5.47% Balance DD) |
| Positive Months | 50 / 53 | 24 / 27 (Worst month: -4.29%) |
2. The Live $100,000 Account Autopsy: What Happened When We Went from $100k to $117k... and Back to $102.2k
Most vendors on MQL5 will stop at the backtest numbers above, put a $5,000 price tag on the EA, and never show you what happens when real money collides with a macro regime shift.
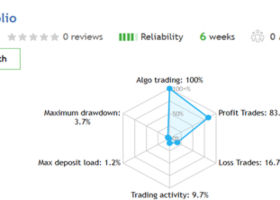
We believe quantitative traders deserve complete forensic transparency. Our master live account on Darwinex ( #4000087051 , $100,000 initial capital, independently verified on FX Blue) has been running in production for over 7 months ( 508 closed positions).
By September 23, 2026, the live account had climbed to $117,018.42 (+17.02%).
Then, between late September and October, the account pulled back to $102,213.53 (+2.21% net, with $0.00 floating drawdown today).
Why did a system validated across 246 million ticks experience a -$14,804 drawdown in a single month? When we ran the trade-by-trade forensic audit on our own live HTML statement, the math revealed an unmistakable lesson in risk scaling and portfolio hygiene:
- Phase 1 (March – August 21): Conservative Baseline (-$462 avg. loss)
For the first 5.5 months (251 trades), the account compounded steadily to +$9,913.53 risking roughly 0.45% (-$462.69 average loss per SL). - Phase 2A (August 24 – September 22): Turning on ABQP at 1.0% Risk Across 14 Unpruned Symbols
When we deployed the multi-asset portfolio in late August, we made two aggressive choices simultaneously: we ran 14 symbols (including GBPUSD , GBPJPY , and FCHI40 before our final 3-gate pruning) and we set risk to 1.0% per trade (-$1,190 to -$1,283 per SL)—nearly 3x the dollar risk per trade and 3x the monthly trade frequency of our first 5.5 months. For the first 4 weeks (86 trades at an 87.2% win rate), that aggressive leverage generated +$7,104.89 in a single month, pushing equity to $117,018. - Phase 2B (September 23 – October 2): The 10-Day Macro Shock at 1.0% Risk (89.1% of the entire drawdown)
During the violent late-September BoJ/Yen carry-trade whipsaw and global index rotation, 58 trades were opened over a 10-day window at that same 1.0% risk (37 Wins / 21 Losses). Because each Stop Loss was sized at -$1,283.40, those 10 days alone accounted for -$13,198.42 (89.1% of the entire drop from the peak)—including 7 multi-day positions opened on Oct 1–2 that finished closing later in October. - Phase 3 (October 3 – Present): The 11-Asset Shield at 0.5% Risk (-$518.85 avg. loss)
On October 3rd, we enforced the strict 11-Asset Validated Shield at the exact 0.5% design risk per trade. Across the 113 live trades opened since October 3rd (83 Wins / 30 Losses, 73.5% Win Rate), even after absorbing a rare 5-consecutive-loss tail event (which has a theoretical probability of p = 0.04% and occurred exactly 5 times across our 11,333-trade historical benchmark), the net cumulative fluctuation over 3 weeks of turbulent October markets has been just -$1,606.47 (-1.55%), with a maximum phase drawdown of only 3.4% ($3,542) and $0.00 floating loss entering the weekend.
The Takeaway for Every Quant Trader:
In a high-win-rate, multi-asset portfolio (71 concurrent slots), 0.5% risk per trade is the structural sweet spot. At 0.5% risk, even a rough month where the Win Rate temporarily dips from 79.5% to 73.5% results in a flat -0.8% to -1.5% month—matching our 2024–2026 validation table (June 2025: 73.48% WR, -0.81%; September 2025: 73.65% WR, -0.62%).
3. Architecture Overview: What Is Inside the .ex5 Engine?
When you load AbacuQuant Portfolio onto a single H1 chart in MetaTrader 5, it initializes a self-contained quantitative execution desk:
+-------------------------------------------------------------------------+ | ABACUQUANT PORTFOLIO ENGINE (H1) | | 1 Chart Instance --> 11 Global Symbols --> 71 Strategy Slots | +------------------+--------------------------+---------------------------+ | SIGNAL ENGINE | RISK & SIZING ENGINE | EXECUTION & GUARDRAILS | | * 19 Trigger | * Dynamic % Risk per SL | * 100% Physical SL & TP | | Families | (Default: 0.5% / slot) | * Slot-Specific Session | | * Per-Slot TF & | * ATR(14) Volatility | Start/End Windows | | Indicator | Normalization | * Max Duration Expiry | | Handles | * Broker Margin & Lot- | * Hard Equity Guardian | | * Closed-Bar | Step Auto-Scaling | (Default 30% DD Cut) | | Evaluation | * Symbol Prefix/Suffix | * Zero Grid / Martingale | | (Zero Repaint) | Auto-Detection | (1 Trade per Slot Max) | +------------------+--------------------------+---------------------------+
- Single-Chart Deployment: Attach the EA to a single EURUSD H1 chart; it automatically resolves broker prefixes/suffixes (e.g., .r , .pro , m ) and manages all 11 instruments.
- Custom Capital & Subset Selection: Every Use_<SYMBOL> input is individually toggleable. On our website's interactive Portfolio Builder, you can toggle any subset of the 11 instruments, input your exact account balance and leverage, and inspect the recalculated historical drawdown and minimum capital requirements before risking a cent.
4. Why We Just Unlocked Monthly Rental on MQL5 Market (+ Full 18-Page Technical Dossier)
Until today, AbacuQuant Portfolio was available on the MQL5 Market exclusively at its full institutional license price of $5,000 USD—reflecting years of R&D, 2.5M+ optimization passes, and a 71-strategy multi-asset codebase.
However, many serious traders, prop-firm operators, and portfolio managers reached out with a fair request:
"We understand the math and the 246M-tick audit, but we want to run the native .ex5 in our own MT5 terminal for a month or quarter before committing to a $5,000 lifetime license."
We listened. Today, we have unlocked three flexible ways to access the AbacuQuant ecosystem:
- NEW — Monthly & Quarterly Rental on MQL5 Market (0% Performance Fee):
You can now rent the full AbacuQuant Portfolio (.ex5) directly on MQL5 Market for 1 Month or 3 Months at an accessible fraction of the lifetime price, run all 71 strategies natively in your own terminal, and keep 100% of your trading profits.
→ Rent Monthly or Download the Free Strategy Tester Demo on MQL5 Market - Hands-Free ABQ Connector (15% Performance Fee on New High-Water Mark Profits Only):
If you prefer not to rent software or manage parameters, you can build your custom asset mix on our website, test it 30 days free on any MT4/MT5 Demo, and connect your live account paying only on net new profits above your High-Water Mark ($0 in flat or negative months). - Full 18-Page Technical & Patent Specification Dossier (Free PDF Download) & Turnkey Institutional Setup:
We have published our complete 18-page Technical & Patent Specification Dossier detailing the state equations, slot inventory, break-even proofs, and real-tick stress tests.
→ Explore the interactive Portfolio Builder, inspect live Darwinex telemetry, and download the 18-page Technical Dossier at:
https://www.abacuquant.com
→ Get the native MT5 Expert Advisor (Monthly Rental / Lifetime License) on MQL5 Market:
https://www.mql5.com/en/market/product/191885
Have questions about minimum capital per instrument, broker symbol mapping, or real-tick Strategy Tester reproduction? Drop a comment below or message me directly here on MQL5—I personally reply to every fellow quant and developer.