Index Cadence loses most of its trades, by design: how to read a 42 percent win rate

Most buyers look at the win rate first. It is the friendliest number in a report: it says how often you will be right. Our index robot is right less than half the time. In its Strategy Tester window, January 2020 to June 2026, 42% of trades ended positive. This post explains why that is not a flaw we are apologising for, what the number has to be read with, and what it will feel like on your account.
Why a robot can lose most of its trades and still make money
A win rate on its own says nothing about money. It counts trades, not the size of them. The size is in two other rows of the same report: the average winner and the average loser.
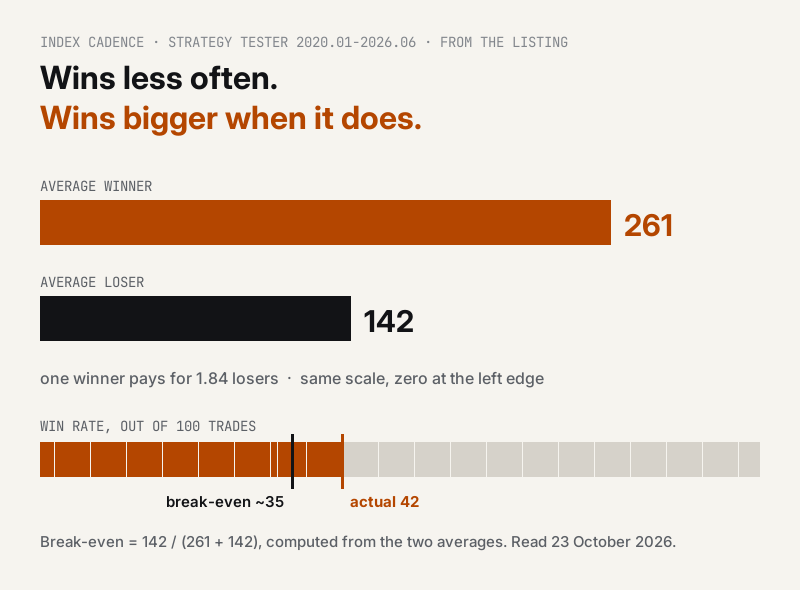
On Index Cadence the average winner made 261 and the average loser lost 142. One winner pays for 1.84 losers. That ratio sets the win rate you need just to break even, and you can work it out yourself from any report: divide the average loss by the average win plus the average loss. Here that is 142 / (261 + 142), about 35%.
So the question is never "is 42% high enough?" on its own. It is "how far above its own break-even line does it sit?" Here the answer is about 7 points. That gap is the edge. The listing states it in risk terms: an expected 0.175 of one risk unit per trade, repeated about 275 times a year. A small number, repeated often, is the whole product.
Where the shape comes from
The robot trades the US tech index intraday, around the US cash open, and is flat before the close. Every position carries a hard broker-side stop from the moment it opens. That stop is what caps a loser. Nothing caps a winner except the end of the trading day.
The extremes of the test show the result of those two rules. The largest single loss was 567. The largest single win was 3919. Losses are many and limited, wins are fewer and open-ended. A system built like this will always lose more often than it wins. If it suddenly started winning most of its trades, something in it would have changed.
Why a high win rate is the easiest number to manufacture
The opposite shape is easy to build and easy to sell. Take profits early, let losing trades run, and most trades close green. The listing puts it plainly: done that way, 85% of trades close in profit while the account bleeds. The losers are rare, and each one is large.
That is why a product page that leads with a win rate tells you very little until you have read the average win and the average loss beside it. On a signal page those rows are in the statistics. In a Strategy Tester report they are in the summary. Read the three together, or not at all.
What a 42 percent win rate feels like: losing streaks
Here is the cost, and it is the part most listings leave out. A robot that loses more often than it wins will lose several times in a row, often. That is arithmetic, not a malfunction. The listing counts every run in the test.
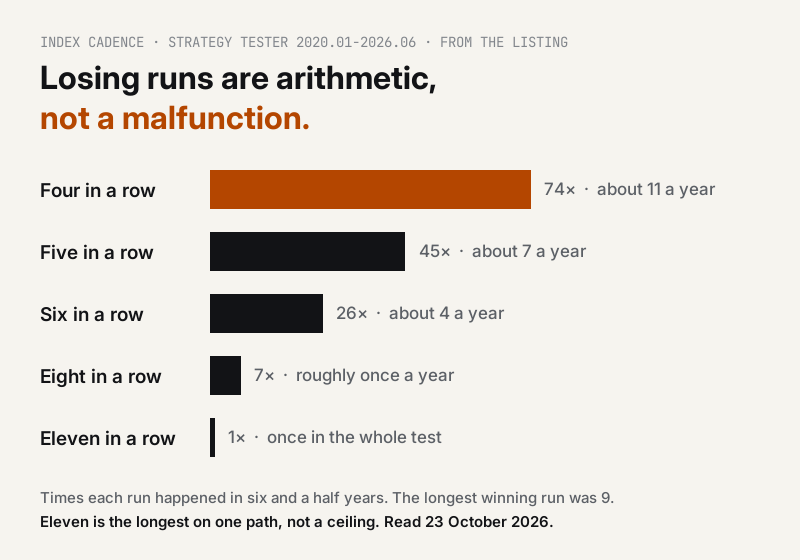
Four losses in a row happened 74 times, about 11 times a year. Five in a row 45 times, about 7 a year. Six in a row 26 times, about 4 a year. Eight in a row 7 times, roughly once a year. The longest was eleven in a row, once in the whole test. The longest run of winners was 9.
Two things follow. First, four losses in your first fortnight is normal for this robot. It is not a sign the edge has gone. Second, eleven is only the longest run on one path through one history. It is not a ceiling. A longer run is possible live, and the account has to be able to sit through one.
What the robot does during a streak
Nothing clever, on purpose. There is no martingale, no grid and no averaging down, so a losing run does not make the next trade bigger. The daily and weekly loss breakers block new entries only. Open positions keep their stops and stay managed. There is no profit cap either, so a good day is allowed to stay good.
The decision that is left is yours: whether you can watch eight losses in a row without switching it off. The stretch you would most want to stop it is usually the one before the recovery. If you know you cannot sit through that, this is the wrong robot for you, and it is better to know before you buy.
Your check, on any robot
1. Find the win rate, the average win and the average loss in the same report.
2. Work out the break-even win rate: average loss divided by average win plus average loss.
3. Compare it with the real win rate. The gap is the edge. A high win rate with a gap of a point or two is thinner than a low one with a wide gap.
4. Find the longest losing run and ask yourself honestly whether you would still be running the robot at the end of it.
Index Cadence on the MQL5 Market, 149 USD, with the free demo to run on your own broker's data: https://www.mql5.com/en/market/product/190845