The volume filter that invented an edge: +0.90 R that never existed

A breakout setup in the US midday lull showed +0.90 R per trade at a 60% win rate, positive every single year since 2015. It would have been by far the best setup in my system. It was a bug, and the bug is one that any backtest with volume confirmation can reproduce. Here is the short version of the case, and the four checks that came out of it.
| Question | Where did a breakout setup with +0.90 R per trade and a 60% win rate come from? |
| Data | 10-minute reference candle at 12:10 New York, NQ, Dow and SPX, 2015 to 2026, 7,941 trades with and 8,816 without volume gate. |
| Answer | From a bug. The volume gate delayed the trigger by a median of 100 minutes while the entry stayed at the level. Without the gate: minus 0.11 R. |
The finding that was too good
Volume confirmation is in almost every breakout textbook: a break only counts once volume is at least at its 20-period average. That rule had sat in my signal generation for years without a problem, because the morning setups it was built for have above-average volume anyway, so the condition is met in the break candle itself. Then I carried the same mechanics into a 10-minute reference candle at 12:10 New York, the quietest phase of the US session, on NQ, Dow and SPX, 2015 to 2026, stop at the opposite side of the candle, trailing exit, net of costs.
| Variant | n | avg R | Win rate | Trigger lag (median) |
|---|---|---|---|---|
| With volume gate | 7,941 | +0.90 R | 59.8% | 100 min |
| Without volume gate | 8,816 | −0.11 R | 29.3% | 0 min |
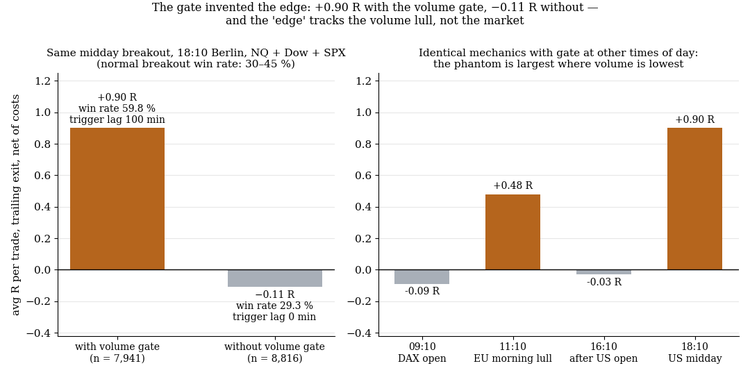
The same setup with and without the volume gate.
The second row is the truth. The first warning should have been the win rate: a breakout with the stop at the opposite side of the reference candle runs at 30 to 45% across all my markets and years. That is the structure of the setup, many small losses for a few large wins. A 60% win rate on a breakout is not a finding, it is a bug. I did not see it immediately because the result was stable year after year, and stability is a poor bug detector when the bug itself is stable.
The mechanics of the error
Two steps in the chain did not fit together. The signal generation sets the trigger to the first candle that satisfies level and volume condition. The episode construction sets the entry, unchanged, to the level plus costs, as if I had bought exactly at the break. In the morning that is the same candle. At midday it is not: volume sits below its average almost continuously, price runs through the level, and the volume condition is only met candles or hours later, when the afternoon picks up. The backtest buys retroactively at a price that no longer exists.
| Metric (NQ and Dow) | Midday setup | Morning setup |
|---|---|---|
| Trigger lag, median | 100 minutes | 0 minutes |
| Price beyond entry level at trigger, median | +0.35 R | n/a |
| Share of trades with price beyond level | 63% | n/a |
| 75th percentile of that distance | +1.2 R | n/a |
The median trade was booked with a free head start of 0.35 R, one in four with more than 1.2 R, and the stop sat correspondingly further away than was possible. That produces 60% and +0.90 R without any market behaviour behind it. This is lookahead bias even though no feature looks into the future. The entry price does.
The diagnostic signature
Before I had the cause in the code, a benchmark showed that something was wrong. The identical mechanics on a grid of times of day, three markets pooled, with the volume gate: 09:10 Berlin (DAX open) −0.09 R, 11:10 (European late-morning lull) +0.48 R, 16:10 (shortly after the US open) −0.03 R, 18:10 (US midday) +0.90 R. The phantom edge is largest exactly where the least trading happens and disappears where the market is active. An edge that has the shape of the volume gap is an edge of the volume filter, not of the market.
What it means for your EA: four checks
- Report the trigger lag, the time between "setup ready" and the actual trigger. A median above 10 minutes is an alarm.
- Measure the price-to-level distance at trigger in R, signed in trade direction. A median above zero means the entry is fictitious.
- Time-of-day grid as benchmark as soon as a new window looks better than the established ones. If quality runs along the activity curve, the mechanics are the suspect.
- Win-rate plausibility. Know the base rate of your setup type. Considerably more is a reason to check the chain, not to celebrate.
Every confirmation rule, volume, close confirmation, second candle, moves the trigger later. The backtest must use the price at trigger time, not the price at the level. And a setup that is twice as good as anything measured so far is more likely a bug than a finding.
Limits
One setup family on three US indices. Whether volume confirmation, computed at the price of the trigger candle, adds anything of its own was not tested.
Full study (all tables, the method, every limit and the PDF): The volume filter that invented an edge
More research notes: my blog · Tools for prop firm accounts: all my products
Historical statistics are no guarantee of future market behaviour. This is not investment advice.