Confluence Sniper: Every Signal Leaves a Receipt You Can Open in a Text File

Any trader who has spent a year on MQL5 knows the move. You attach a signal indicator, scroll back over the chart, and every arrow sits perfectly on a swing low, so you buy it. A week of live trading later, the arrows on your screen do not look anything like the ones in the screenshots. Some have quietly shifted. A couple that were winners last Tuesday are gone entirely.
That is the credibility problem at the centre of this whole category, and after years of building trading tools I stopped trying to argue my way around it. I built a structural answer instead. But the fix only makes sense once you can name exactly how a signal indicator lies to you, so let me be precise.
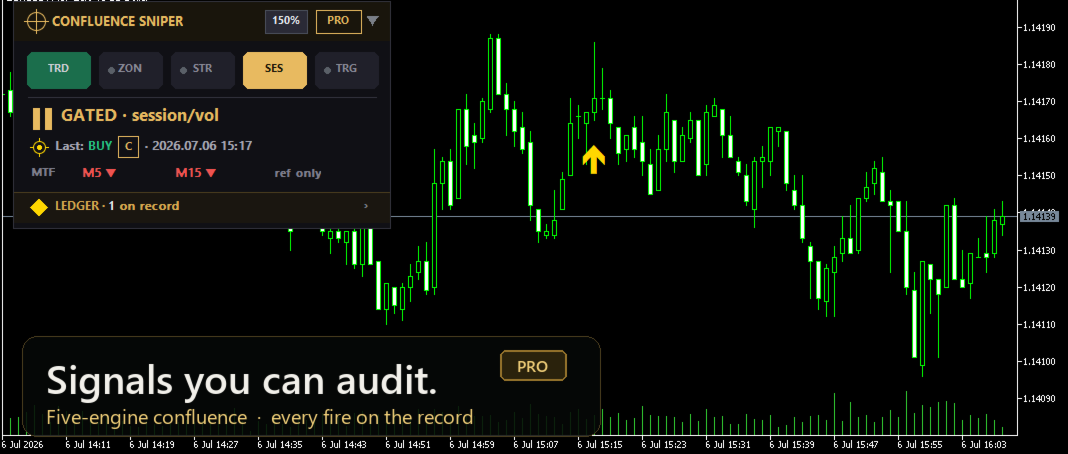
Confluence Sniper on EURUSD: a graded signal, a gold arrow, and a panel that shows exactly why it fired. Nothing here was redrawn after the fact.
The three ways a signal indicator lies
The first and most common lie is the repaint. An indicator computes its arrows using data that was not available when the arrow claims to have fired, referencing the still-open bar or peeking at future candles as it redraws on history. The chart looks like it saw the move coming because, on history, it did. In live trading that same code has no future to peek at, so it hesitates, shifts, and repaints.
The second lie is the irreproducible backtest. A vendor shows you a tester report or a gallery of clean entries, but you have no way to regenerate it on your own terminal, on your own broker's data, and confirm the arrows land where the marketing said. The evidence and the product are two separate things, and only one of them is in your hands.
The third lie is the quiet edit. Even an honest-looking indicator recalculates its historical signals every time you change a setting, reload the terminal, or switch timeframes. There is no fixed record of what it actually claimed in real time, which means history can be improved after the fact and you would never know.
None of these are solved by a seller saying "trust me, it does not repaint." That sentence cannot be disproven, which is exactly why it is worthless. The only real fix is to keep a record the tool itself never alters, then hand you the tools to check it yourself. So that is what I built, around one simple rule: every signal has to leave a receipt.
The Ledger: a signal that cannot rewrite its own past
Here is the mechanism, because the mechanism is the point. The instant a signal bar closes, the signal is written permanently to a plain CSV file on your own PC. Symbol, timeframe, direction, grade, timestamp, the numbers behind it. Once that bar is closed, that line is on disk and it is done.
When the indicator draws its history, it does not recalculate anything. It reads the file. Every historical arrow you see is redrawn from the recorded line, not re-derived from current prices with the benefit of hindsight. That single design choice means the indicator never redraws its own history, not as a marketing promise, but as a consequence of where the data lives. The file is a plain CSV on your PC, so you can read it, and you could also edit it; the point is that the tool itself never does. A signal that already exists as text in a file cannot quietly move or vanish the next time a bar closes.
I wanted this to be something you could check, not something you had to believe. So there is a wax-seal band on the panel. Click it and you see the last few records straight from the ledger, plus the full file path. Open that CSV in any text editor you like. No special format, no encryption, nothing you have to take my word for. If the panel says a signal fired at a certain price and grade, the raw file says the same thing, because the panel counts are computed only from real recorded fires and nothing else.
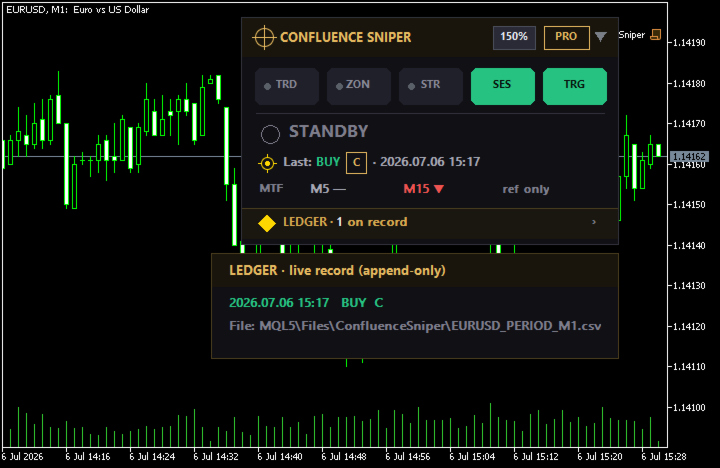
Click the wax seal and the panel shows the exact CSV path on your own disk. Open it in any text editor and check every count yourself.
One more distinction matters for honesty. Live fires, the signals actually recorded as their bar closed, are drawn as solid gold arrows. Any hypothetical projection of how the logic would have behaved before the ledger existed is drawn hollow and kept visually separate, so a real receipt is never dressed up as a what-if.
Five engines, so the receipt is worth reading
A ledger only means something if the signals it records were worth recording. A permanent log of noise is just organised noise. So the reason a signal reaches the file in the first place is confluence: five independent engines each cast a vote on the same closed bar, and the arrow only prints when they agree.
That independence is the point. If five people who all read the same newspaper agree with you, you have learned nothing. If five people who studied trend, structure, relative strength, timing, and the candle itself arrive at the same conclusion separately, that agreement is worth something. It does not guarantee anything, and I will never pretend it does, but it is a far higher bar than any one of them clearing alone.
The first engine is Trend Consensus: several trend models have to line up, gated by an ADX strength check so it stays quiet in directionless chop. The second is Zone Context: is price reacting at a fresh order block that has not already been consumed, evaluated strictly point-in-time using only what was known when the bar closed, so it can never look ahead. The third is Currency Strength, weighing the base currency basket against the quote, because a good-looking setup is a bad one if both currencies are pulling the same way. The fourth is the Session and Volatility Gate: signals are only allowed inside your chosen hours, and dead or overheated conditions, measured by ATR percentile, are skipped. The fifth is the Price Action Trigger, which wants a genuine break or engulfing candle on the signal bar itself. Something has to physically happen.
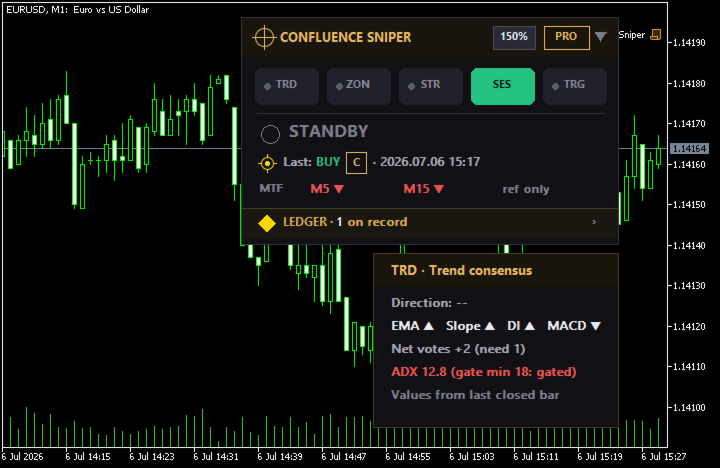
Hover an engine to read its raw vote. Here Trend Consensus is leaning long, but ADX sits below the gate, so it is greyed out and not counted. The tool declining, on the record.
Each signal is then graded. A means three engines aligned. B means two aligned with Zone Context required, because I trust structure more than any single momentum read. C is weaker context, and by default the tool does not even show it. Out of the box you see B and above, which is why the arrows are deliberately infrequent, on the order of half a signal to roughly one and a half per symbol per week at default settings. That is a design choice, not a performance claim.
The consequence is that the tool is quiet most of the time, and that silence is behaviour you can watch, not a benefit I am asserting. You will see a clean-looking trend form at lunchtime, glance at the panel, and find the volatility chip greyed out because the move is happening in a liquidity vacuum. The tool is not confused. It is declining. Every bar where the engines disagree is a bar where I have no edge worth acting on, and I would rather it tell me that plainly than manufacture a reason to trade.
What it refuses to promise
Let me be direct about what this tool does not do. It makes no win-rate claim. It shows no profit figure. There are no invented statistics anywhere in the panel, because the moment you invent a number you are back in the world of charts that lie. It shows what the engines observed, what actually fired, and an honest view of trading costs, because a rare signal fired into a wide spread on an exotic pair is still a bad trade, and a tool that hides that number is telling you another comfortable lie.
The panel keeps this readable. One stance line reads bullish, neutral, or bearish. Engine chips dim when a gate blocks them, so you can read at a glance why a setup did or did not qualify. Hover any element and the underlying numbers appear. It is draggable, resizable, and collapsible. Each engine shows only its own vote here; for the full depth of any single method the panel points to my specialist tools for trend, order blocks, currency strength, and sessions. Confluence Sniper is the hub that combines their verdicts into one auditable stance.
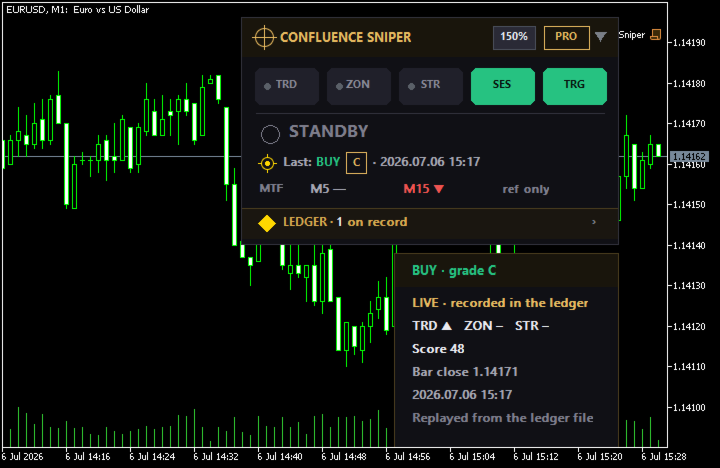
A completed signal, replayed straight from the ledger file: the grade, the engines that agreed, and the bar it closed on. The same line you can open on disk.
FREE and PRO
The free version is genuinely the whole idea: the complete five-engine logic plus the full ledger, live on your current chart. That is not a crippled demo. It is the entire honesty mechanism, working, for nothing, and you can verify every claim in this post with it. You can find it here: https://www.mql5.com/en/market/product/184567
The Pro version at 49 USD, a one-time purchase, is for when the silence becomes a workflow problem. If the tool only fires once or twice a week per symbol, you do not want to babysit the chart waiting for it. Pro adds terminal popup alerts, mobile push notifications, and email alerts so the signal reaches you wherever you are. It adds a higher-timeframe context row that is explicitly marked as context and does not change the grade, so you get the bigger picture without the tool pretending the higher timeframe voted. And a multi-symbol scanner follows in an update, because the natural way to trade a rare-signal tool is to watch many symbols and take the few that align. None of it changes the honesty of the signal; it changes how quickly you hear about one. Pro lives here: https://www.mql5.com/en/market/product/184568
Do not trust it. Audit it.
If you take one thing from this, let it be a habit rather than a purchase. The next time any signal tool impresses you with its history, ask a single question: can I open the record it kept in real time, or am I only seeing a picture it redrew for me just now? If the honest answer is the latter, you are looking at a claim, not evidence.
I built Confluence Sniper so the answer is always the former, including for my own claims. Do not trust the non-repaint line on this page. Load the free version, let it record a few fires of its own, then click the wax seal and open that CSV against your chart with your own eyes. A tool that is willing to be checked is a different kind of tool than one that asks for your faith.
If this way of thinking resonates, you might also want to read my earlier piece on why an order block has to be evaluated point-in-time to mean anything, since that same refusal to look ahead is exactly what the Zone Context engine enforces here. Same principle, smaller lens. Audit first, believe second.



![[EURUSD]: Weekly Liquidity Activation Points (LAP), October 12-16, 2026](https://c.mql5.com/6/1035/splash-preview-777305.png "[EURUSD]: Weekly Liquidity Activation Points (LAP), October 12-16, 2026")