
BTC Weekly Review, June 7-12, 2026: The Week That Punished Every Forced Trade

Price moved all week.
But clean trades did not appear everywhere.
The market stayed trapped between major memory.
That was the real pressure from June 7 to June 12, 2026.
Some sessions gave trades.
Some sessions gave movement.
Some sessions gave nothing worth taking.
That difference mattered.
A trader who chased every candle had a difficult week.
A trader who waited for the line had a chance.
June 7 started with expansion inside old June 4 US memory.
June 8 compressed under upper pressure.
June 9 tested lower memory again.
June 10 and June 11 gave rotation trades.
June 12 crowded the lines so tightly that no clean trade became the strongest answer.
The market did not reward prediction.
It rewarded selection.
Price reached a boundary.
It reacted.
It either held or failed.
Only then did the trade deserve attention.
Full Weekly Lecture
Watch the full BTC weekly structure review here
Related MQL5 Market Product
This is the same execution discipline I use when studying automated trading logic.
Session structure.
Level memory.
Risk reward filter.
And no trade as a valid output.
View the related MQL5 Market product here
Chart 1 - Daily Chart
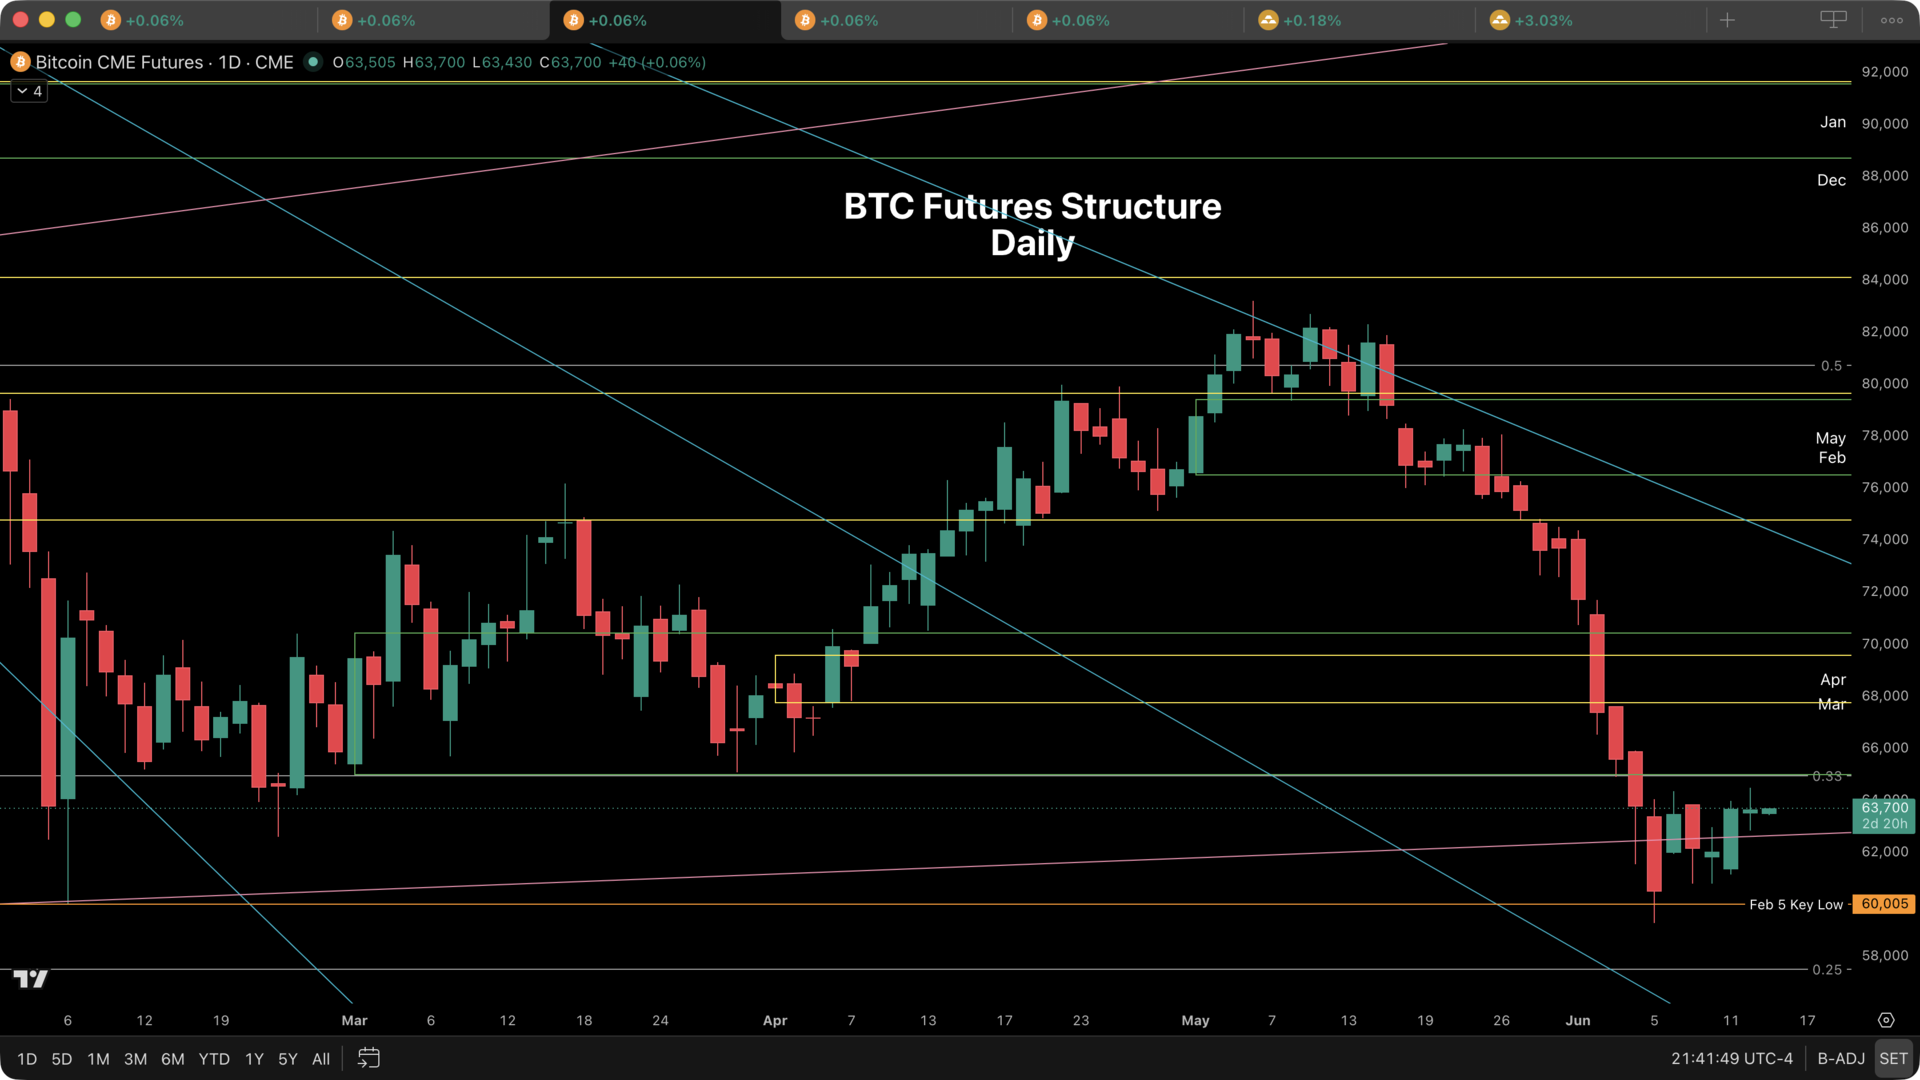
The daily chart showed why the one hour chart felt fast and unstable.
June formed inside empty memory between the February daily lower area and the March daily structure.
It did not form safely above strong support.
It did not form inside clean recovery.
It formed in the gap.
When price forms in empty space, movement can travel quickly from one boundary to the next.
That is what happened.
Price broke below April daily memory.
Then price broke below March daily memory.
Then price reached the February 5 key low.
Each break changed the pressure.
April could not hold.
March could not hold.
Weekly 0.33 could not protect the move.
Then the February 5 key low became the next decision area.
That is why the one hour trades were not simple.
Short traders saw continuation.
Long traders saw lower memory.
Both sides had a reason to act.
But a reason is not enough.
The level had to hold.
The session had to give the line.
The stop, entry, and target had to pay.
If price bounced from the February 5 key low but could not reclaim higher memory, the long stayed limited.
If price broke the key low but could not offer clean reward to weekly 0.25, the short also had to wait.
That was the daily message.
Important levels create movement.
They do not automatically create execution.
Chart 2 - Weekly Chart
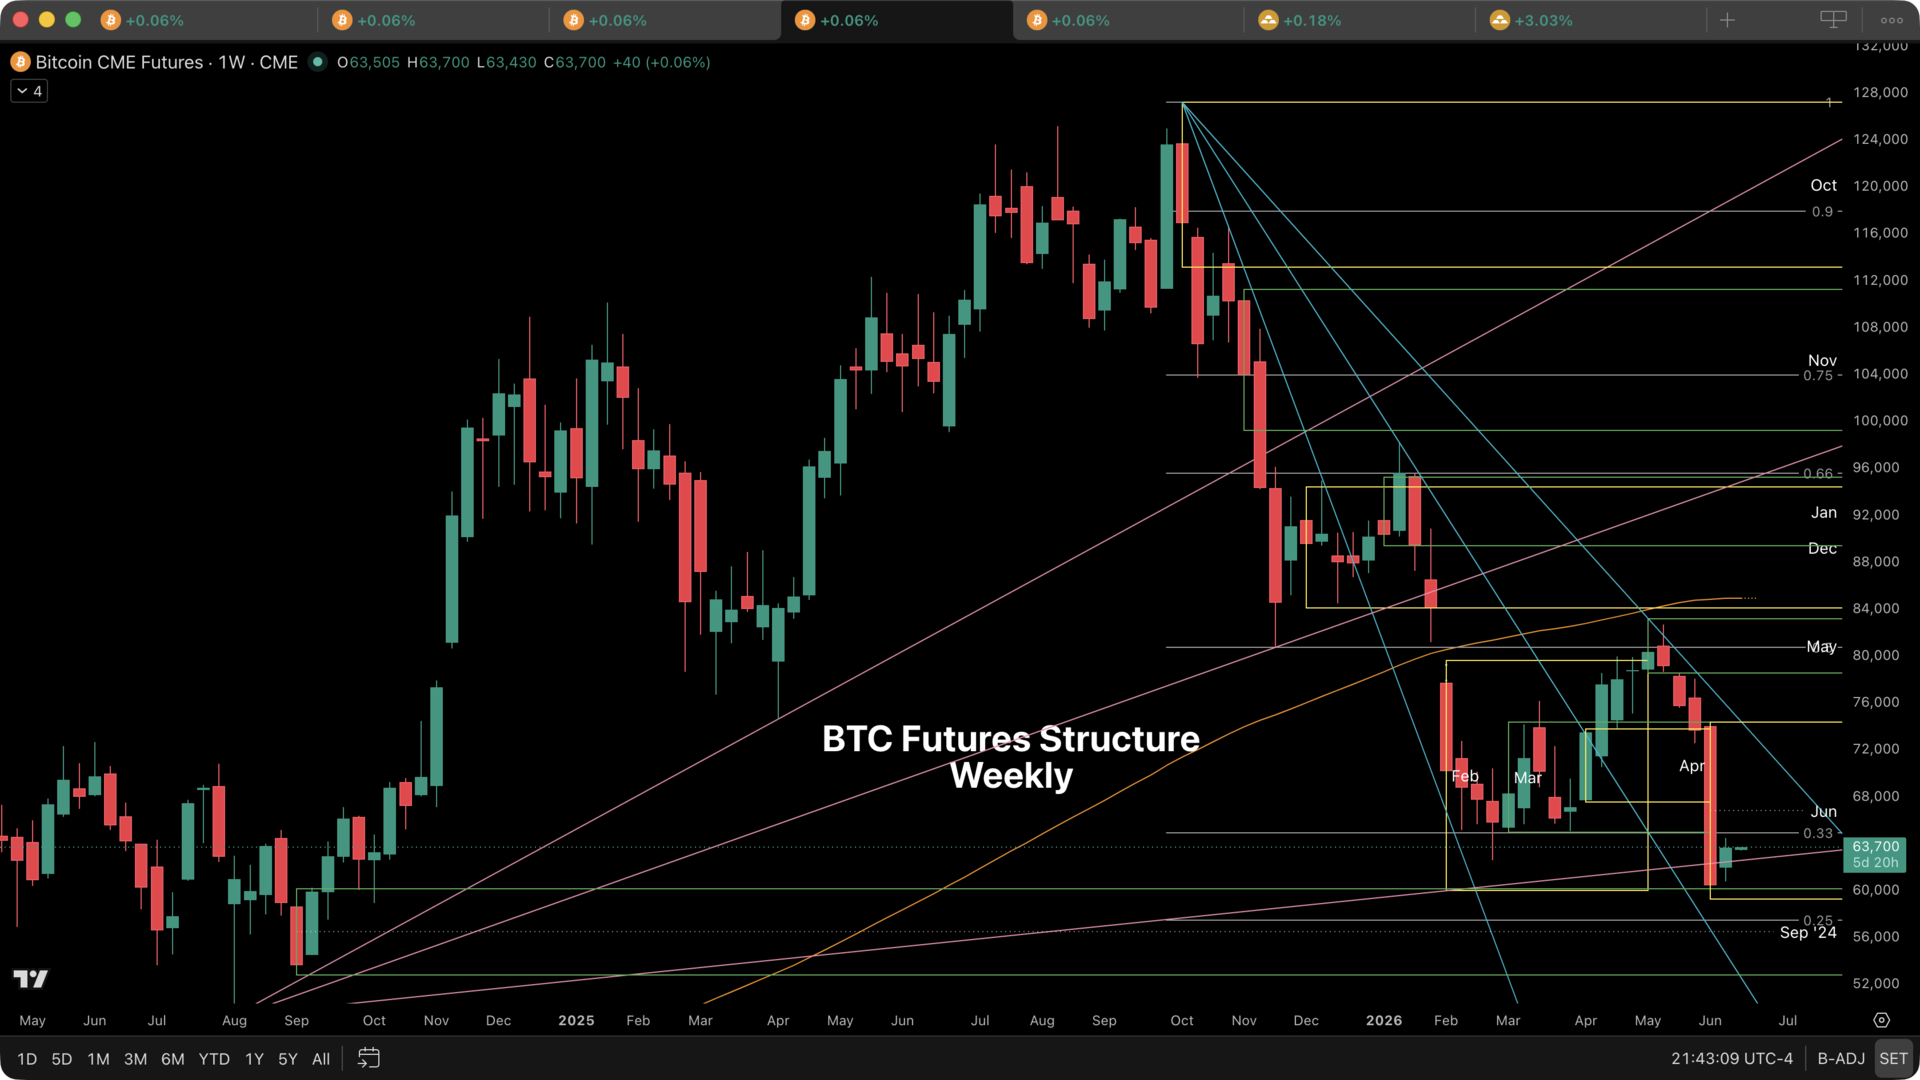
The weekly chart gave the trap.
June expanded inside February weekly memory after months of compression.
March compressed inside February.
April compressed inside March.
May compressed near the February upper area.
Then May failed.
June opened the range lower.
That changed the week.
The one hour chart looked like rotation.
But the weekly chart showed why rotation kept returning to the same fight.
Price stayed between weekly 0.25 and weekly 0.33.
Weekly 0.33 blocked recovery from above.
Weekly 0.25 waited below.
The February 5 key low kept pulling attention.
That field created the flip trades.
June 7 Asia gave a long from lower memory with 1.79 risk reward.
June 8 US gave a short from compressed upper failure with 1.86 risk reward.
June 8 Asia gave both sides.
Long from June 4 US lower memory.
Short from midpoint failure.
Both around 1.82 risk reward.
June 9 US gave a lower bounce with 1.66 risk reward.
June 9 Asia gave a short first, then a long from lower memory.
The long grew only after price earned the trail.
June 10 and June 11 kept the same pressure alive.
The best setup came when the line, stop, and target aligned.
The weakest setup came when too many lines crowded the same area.
That is why June 12 mattered.
Price moved.
But the lines were too close.
The risk reward did not cleanly pay.
No trade protected the account.
That was not hesitation.
That was the same method doing its job.
Chart 3 - Monthly Chart
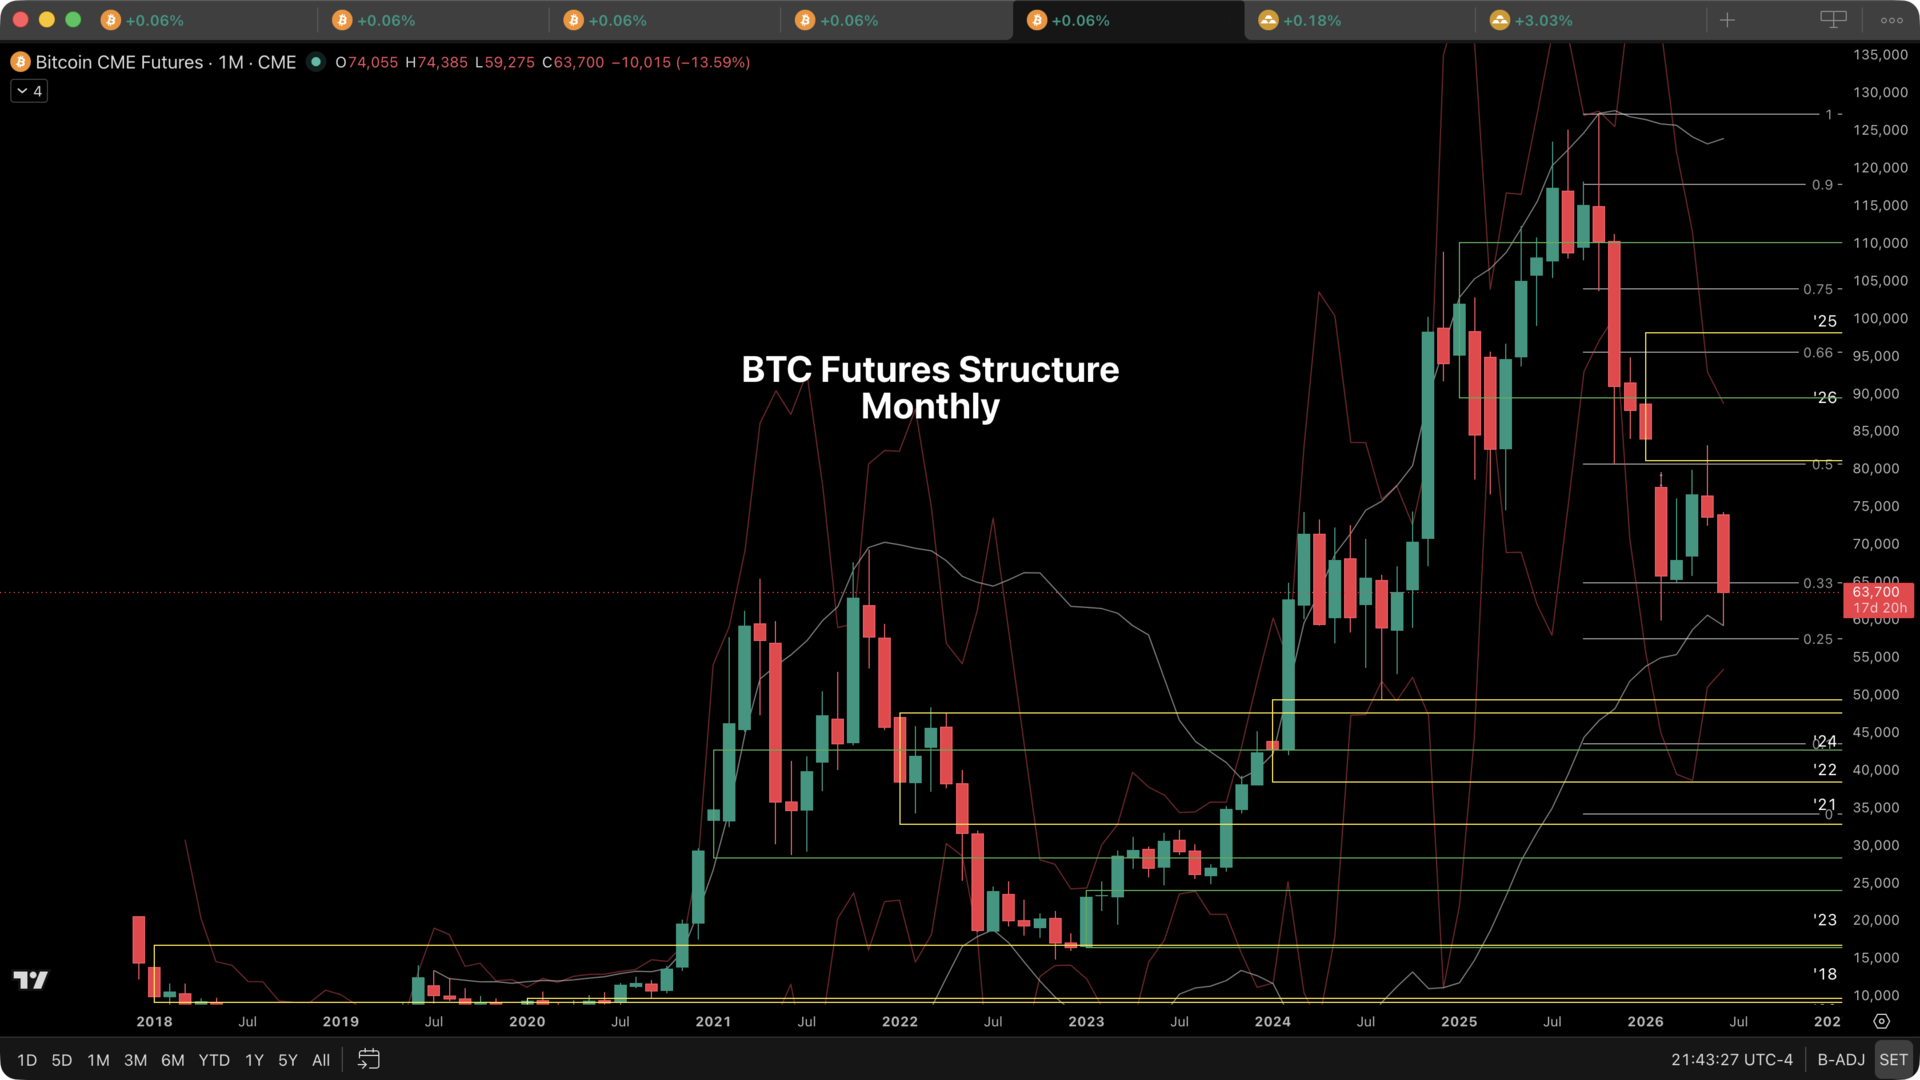
The monthly chart kept the larger pressure heavy.
June tested the February monthly low.
The candle still carried strong downside pressure.
Weekly 0.25 stayed close below.
The February low stayed active as the main decision zone.
Buyers could not treat the low as automatic support.
Sellers could not chase after the move was already stretched.
Both sides could fail there.
May already failed near the lower boundary of the 2026 monthly basis box.
April stayed between 0.33 and 0.5.
March left the upper wick.
February created the damage.
June returned to that damage.
The monthly sequence stayed clear.
Drop.
Reaction.
Failure.
Return.
That sequence made next week dangerous.
If BTC holds the February low and reclaims weekly 0.33, the long can be studied later through one hour session memory.
If BTC reaches weekly 0.33 and fails again, short pressure can return.
If BTC loses the February low and cannot reclaim it, weekly 0.25 becomes critical.
If BTC rotates between weekly 0.25 and weekly 0.33, the account must stay selective.
The monthly chart gives the warning.
The weekly chart gives the field.
The daily chart gives the path.
The one hour chart gives the trigger.
The Real Lesson From June 7-12
This week was not about being bullish.
It was not about being bearish.
It was about surviving the space between both sides.
When lower memory held, the long could work.
When upper memory failed, the short could work.
When the middle became crowded, the best trade was no trade.
That is the part most traders miss.
They see movement.
They want action.
They enter before the trade earns it.
But the account does not need every move.
It needs the move where the line holds, the stop makes sense, and the target pays.
Stop.
Entry.
Target.
Risk reward.
If those four do not align, the trader waits.
Next week stays conditional.
If price reclaims weekly 0.33 and holds, the long can form later.
If price fails under weekly 0.33, the short can return.
If price breaks the February low and cannot recover, downside pressure grows.
If price stays trapped between weekly 0.25 and weekly 0.33, the account must not force trades.
Price reaches.
It reacts.
It holds or fails.
Only then does the trade begin.


")
