 Backtest/Simulation Guide")

Pass or Breakeven (POBE) — Backtest Guide
Download free trial demo from the product page:
Run POBE in the MT5 Strategy Tester to see the lifecycle mechanics in action before purchasing. Follow the steps below to get started immediately.
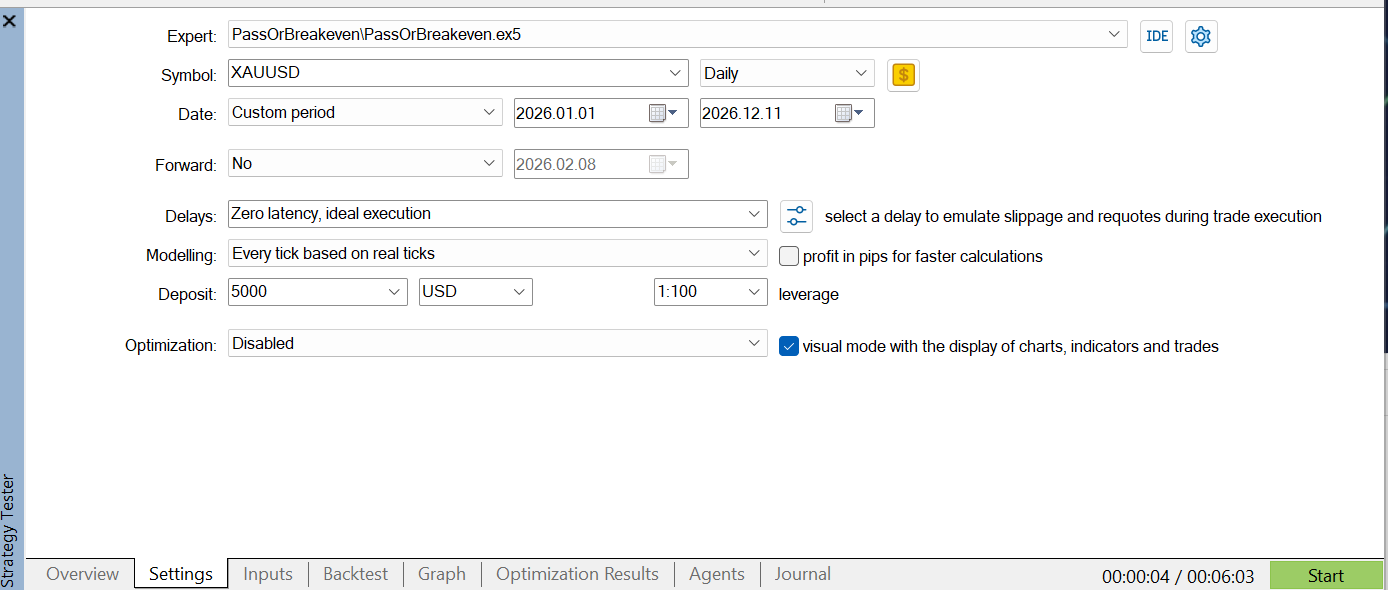
Step 1 — Open the Strategy Tester
Press Ctrl+R in MT5 or go to View > Strategy Tester. Configure as follows:
| Expert Advisor | Pass or Breakeven |
| Symbol | US2000 or USTEC (recommended) — or XAUUSD if indices are not available |
| Timeframe | D1 |
| Date range | From 2026.01.01 to present |
| Modelling | Every real tick (recommended). Open prices only or OHLC on M1 also work. |
| Deposit | Match your prop firm account size (e.g. 100000 for a $100k challenge) |
| Leverage | Match your prop firm leverage (e.g. 1:100) |
Visual Mode: Tick
Setup tester this way:
Step 2 — Set Three Inputs
Click the Inputs tab. Only three settings need to be changed. Everything else uses defaults that match most standard two-phase prop firm rules.
- Prop Firm Type (Section 1) — select your prop firm
- Phase (Section 1) — set to Phase 1
- Challenge Cost ($) (Section 1) — enter the fee you paid or will pay for your challenge in USD
Step 3 — Check the Lifecycle Map Before Starting
After pressing Start, visual windows will be opened (for MT5) or a Visual testing tab will appear (for MT4), look at the blue lifecycle map display. Confirm:
- POBE Index shows GOOD or above. If it shows NOT SUITABLE , check that Challenge Cost, Profit Target, and Payout Rate are entered correctly.
- The [FAIL] and [PASS] figures are visible for each phase. Note these values — you will compare them against the simulated broker result at the end.
Step 4 — Press Start
The EA will trade through the date range. One of two things will happen:
- Green box shows Profit Target Hit PASSED!!! — the challenge passed
- Green box shows Max DD Breached BREAKEVEN! — the challenge failed at max drawdown
Either outcome is correct and expected. The test ends when one condition is met.
Step 5 — Check the Result
Yellow box (Simulated Broker): Compare the final P/L against the [FAIL] or [PASS] figure shown in the lifecycle map display. The actual result should be within approximately 5 to 15% of the theoretical value. This confirms POBE is working correctly for your configuration.
Run the test again with a different date range to observe a different outcome. Both pass and fail outcomes are valid — what matters is that the broker result tracks the lifecycle map prediction.
Take Note — The simulated broker runs under ideal conditions. Real-world results will be slightly lower due to three factors: spread on both accounts widens the gap between fills, slippage during fast-moving markets causes the two terminals to execute at different prices, and volatility affects how quickly or slowly the challenge reaches its target or drawdown limit. Expect actual outcomes to fall within 5 to 15% below the simulated figures. This is normal and expected.
Recommended — Run Phase 2 Next
Phase 2 is the most important outcome to experience before purchasing. Failing Phase 2 produces a net profit on the broker account — the most counterintuitive and compelling result POBE produces. Seeing this in the backtest demonstrates the core value of POBE more clearly than any other outcome.
To run Phase 2 after a Phase 1 pass:
- After Phase 1 completes with PASSED!!!, note the simulated broker balance — it should show the [PASS] sunk cost from the lifecycle map
- Go to Inputs and change Phase from Phase 1 to Phase 2
- Press Start with a new date range
- If Phase 2 hits max drawdown — green box shows Max DD Breached BREAKEVEN! — check the yellow box. The simulated broker should show a net positive result after accumulating gains across both phases. This is the profit-from-failing outcome.
Change the test date range to experience different outcomes at various phases. Each run may end differently depending on what the market did during that period — this is expected and correct.
This single result — failing Phase 2 and walking away with
ofit — demonstrates why POBE is a fundamentally different product from any other prop firm EA.
Understanding the Backtest Display
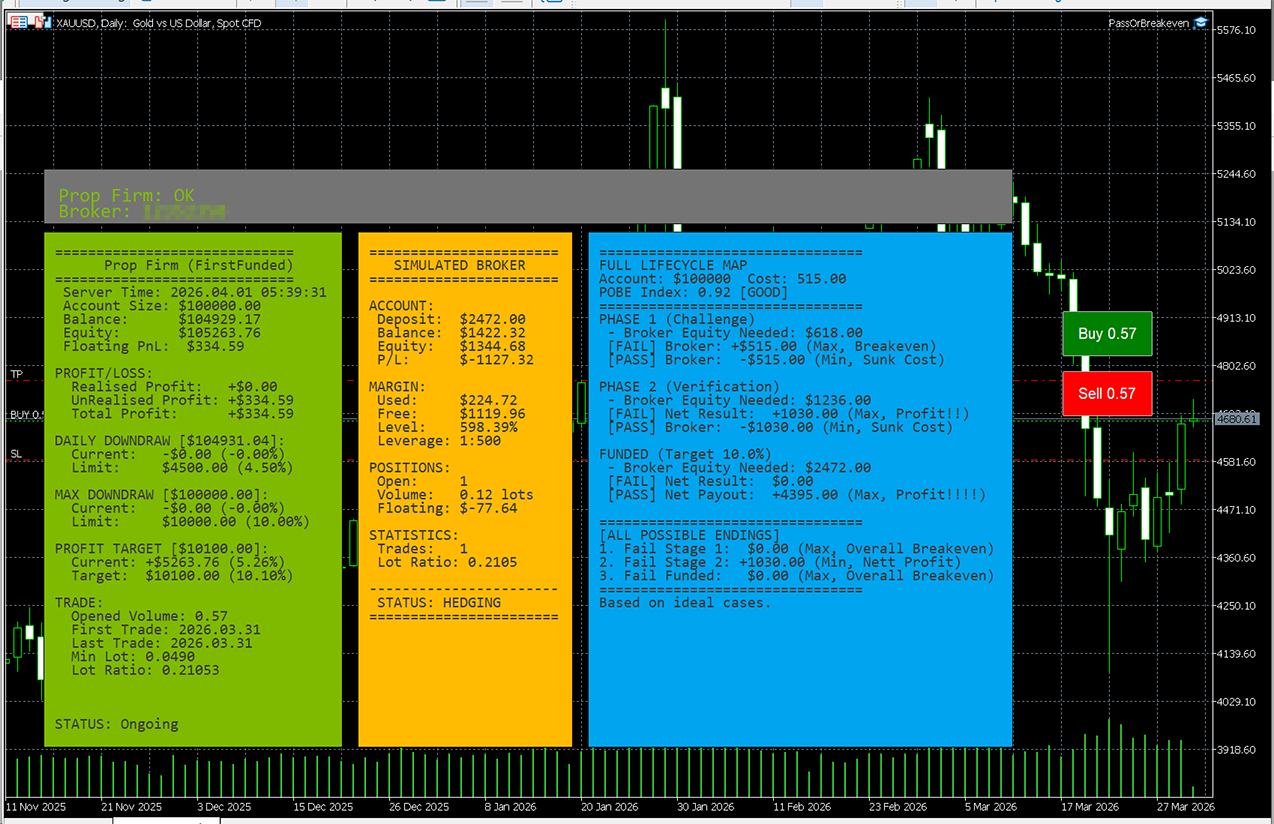
When running Pass or Breakeven in MetaTrader's Strategy Tester, you will see three panels displayed live on the chart — the same view you see in live trading. This is a single-account simulation. No second broker account is required during backtesting. The simulated broker is calculated internally by the EA.
Green Panel — Prop Firm Account Shows the simulated prop firm side: account balance, equity, floating P&L, daily drawdown, max drawdown, and profit target progress. The Status field at the bottom tells you where you are in the lifecycle — Ongoing, Passed, or Breakeven. This is the account you are trying to pass.
Yellow Panel — Simulated Broker This is the EA's internal hedge simulation. It shows the broker deposit used, current balance, open positions, lot ratio, and margin levels. No real second account is needed — the EA calculates the hedge result mathematically. Status shows HEDGING when a position is active.
Blue Panel — Full Lifecycle Map This is the most important panel for evaluation. Before placing any trade it shows:
- POBE Index — rates the hedge quality (Weak / Average / Good / Excellent). Aim for Good or above before using on a live challenge
- Equity Needed — exact broker deposit required for Phase 1, Phase 2, and Funded
- Expected results — what you walk away with if each phase fails or passes
- All Possible Endings — the three terminal outcomes summarised in one place
Run the backtest on your chosen symbol and account size, check the POBE Index and Equity Needed figures, and use those numbers to set up your live challenge with confidence.
Default Parameter Reference
The following defaults are pre-configured and match most standard two-phase prop firm rules. Adjust only if your prop firm uses different values.
| Phase 1 Profit Target | 10% |
| Phase 2 Profit Target | 5% |
| Daily DD Limit | 5% |
| Max DD Limit | 10% |
| Minimum Trading Days | 4 days |
| Trading Period | Unlimited |
| Fee Refund on Funded | Yes |
| Payout Rate | 80% first payout (depending on the prop firm) |
Always enter the exact fee shown on your prop firm's pricing page in USD.
How to See All Three Outcomes
Breakeven (fail Phase 1)
The prop firm account hits maximum drawdown. The simulated broker balance should approximately match the lifecycle map [FAIL] figure for Phase 1 — representing recovery of the challenge cost.
Profit from failing (fail Phase 2)
Run a test where Phase 1 passes, then change the Phase setting to Phase 2 and run a second test. If Phase 2 hits max drawdown, the broker result should show the net positive [FAIL] figure from the lifecycle map for Phase 2.
Maximum profit (pass all phases)
Run Phase 1 to a pass, Phase 2 to a pass, then the Funded phase to the profit target. The final simulated broker result combined with the funded payout and fee refund should match the lifecycle map [PASS] figure for the Funded phase.
Note: passing Phase 1 and Phase 2 is not the end of the POBE lifecycle — it is the midpoint. The broker account carries a sunk cost from both evaluation phases. The funded phase is where that cost is recovered, either through a funded profit or a funded breakeven. Always run the funded phase through POBE to complete the full lifecycle.
Why the Result May Differ from the Lifecycle Map
- Simulated broker deposit too low — check for LOW MARGIN or MARGIN CALL in the yellow box. Switch Simulated Broker Account Size Mode to Auto or increase the deposit manually.
- Challenge parameters do not match your prop firm — verify profit target, daily DD, max DD, and minimum trading days in Sections 10 and 11.
- Commission not entered — if your prop firm charges commission per lot, enter it in the Prop Firm Commission Per Lot field in Section 30.
What the Backtest Does Not Show
- The live two-terminal heartbeat connection — this only operates in live mode
- Real broker execution, spread, and slippage — the simulated broker uses configured values only
- The red broker account box — this only appears on the live broker terminal
Common Mistakes
Expecting the same outcome every time
Different date ranges produce different outcomes depending on what the market did. This is expected. The point is that whatever outcome occurs, the broker result tracks the lifecycle map prediction.
Comparing the wrong figures
Compare the simulated broker P/L against the lifecycle map [FAIL] or [PASS] figure, not against the prop firm account result. The two accounts move in opposite directions by design.
Not enabling Show Simulated Broker
If Show Simulated Broker is false, the yellow box will not appear. Always enable it for backtest evaluation.
Misreading PASSED!!! as the EA predicting a pass
POBE does not predict pass or fail. It manages what happens financially when each outcome occurs. A different date range may produce a BREAKEVEN! result. Both are valid.
Take Note
Spread, slippage, and commission are already factored into the simulated broker figures. What the simulation cannot fully capture is that some brokers widen spread dramatically during volatile periods or news events, and there is always a small execution delay between the prop firm fill and the broker copy during which price can move in the real world. Both factors create friction beyond what was configured. The better, faster and cheaper your broker relative to your prop firm, the closer your live results will be to what the simulation shows.
Two-terminal hedge EA for two-phase prop firm challenges. Opposing positions on a broker account produce a calculated result across all four possible lifecycle outcomes.


")