User Guide: Market Structure Functionality in the Trading System


What is Market Structure?
Market Structure helps you identify whether the market trend is bullish, bearish, or sideways by analyzing swing highs and swing lows.
Simply put:
-
Price keeps making higher highs + higher lows → the market is in an Uptrend.
-
Price keeps making lower highs + lower lows → the market is in a Downtrend.
-
Not clear / inconsistent → the market is Ranging.
In addition, the module detects two important events:
-
BOS (Break of Structure): Price breaks the structure in the current direction → the trend continues.
-
CHoCH (Change of Character): Price breaks the structure against the current direction → the trend may reverse.
-


How to enable Market Structure
Market Structure is built into these indicators: Mirage, PinBar, InvertedHammer (and the Template). When you attach the indicator to the chart, Market Structure runs automatically — no extra installation is required.
To adjust parameters: right-click the indicator → Properties (or press F7) → find the parameter groups whose names start with "Fractal", "ATR", "Show Swing"...
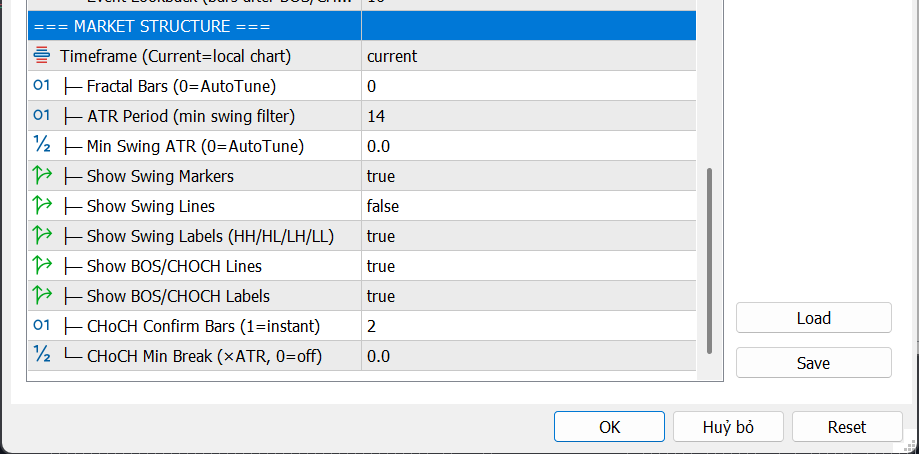
Input parameters explained
1. Timeframe — Analysis timeframe
| Info | Details |
|---|---|
| Name in indicator | Timeframe (Current=local chart) |
| Default | PERIOD_CURRENT (uses the currently opened timeframe) |
| Values | M1, M5, M15, M30, H1, H4, D1, W1... or Current |
Meaning: Select the timeframe used to determine structure. If set to Current, the indicator analyzes the exact chart timeframe you are viewing.
When changing it:
-
Choose a higher timeframe (e.g., H4 on an M15 chart) → more “big picture”, less noise, but signals are more delayed.
-
Keep Current → reacts faster to price changes, but can be noisy on small timeframes.
Tip: If you trade on M15, try setting Timeframe = H1 to view higher-timeframe structure and confirm the main trend.
2. Fractal Bars — Fractal width (candles on both sides of a swing)
| Info | Details |
|---|---|
| Name in indicator | Fractal Bars (0=AutoTune) |
| Default | 0 (automatic) |
| Range | 0 to 10 |
| Unit | Number of candles (bars) |
Meaning: To confirm a swing high, the indicator checks whether that candle’s high is higher than N neighboring candles on both sides. That N is Fractal Bars.
When changing it:
-
0 (AutoTune) → the indicator automatically selects an optimal value (typically 2 to 4) for most cases.
-
Increase (3, 4, 5...) → detects only larger, clearer swings → fewer signals but higher quality.
-
Decrease (1, 2) → detects smaller swings → more signals but more noise.
Tip: Keep 0 (AutoTune) in most cases. Only increase to 3–5 if you trade swing/position and want to filter smaller swings.

3. ATR Period — ATR lookback used for swing filtering
| Info | Details |
|---|---|
| Name in indicator | ATR Period (min swing filter) |
| Default | 14 |
| Range | 2 to 100 |
| Unit | Number of candles (bars) |
Meaning: ATR (Average True Range) measures the average price range. This parameter defines how many recent candles are used to compute ATR, which is then used to filter out swings that are too small (insignificant).
When changing it:
-
Increase (20, 50...) → smoother ATR, reflects longer-term range → stable filtering but slower adaptation.
-
Decrease (5, 7...) → more sensitive ATR → adapts faster but can fluctuate more.
Tip: 14 (default) fits most pairs and timeframes. You typically don’t need to change it unless you trade very small timeframes (M1/M5 → consider 7–10).
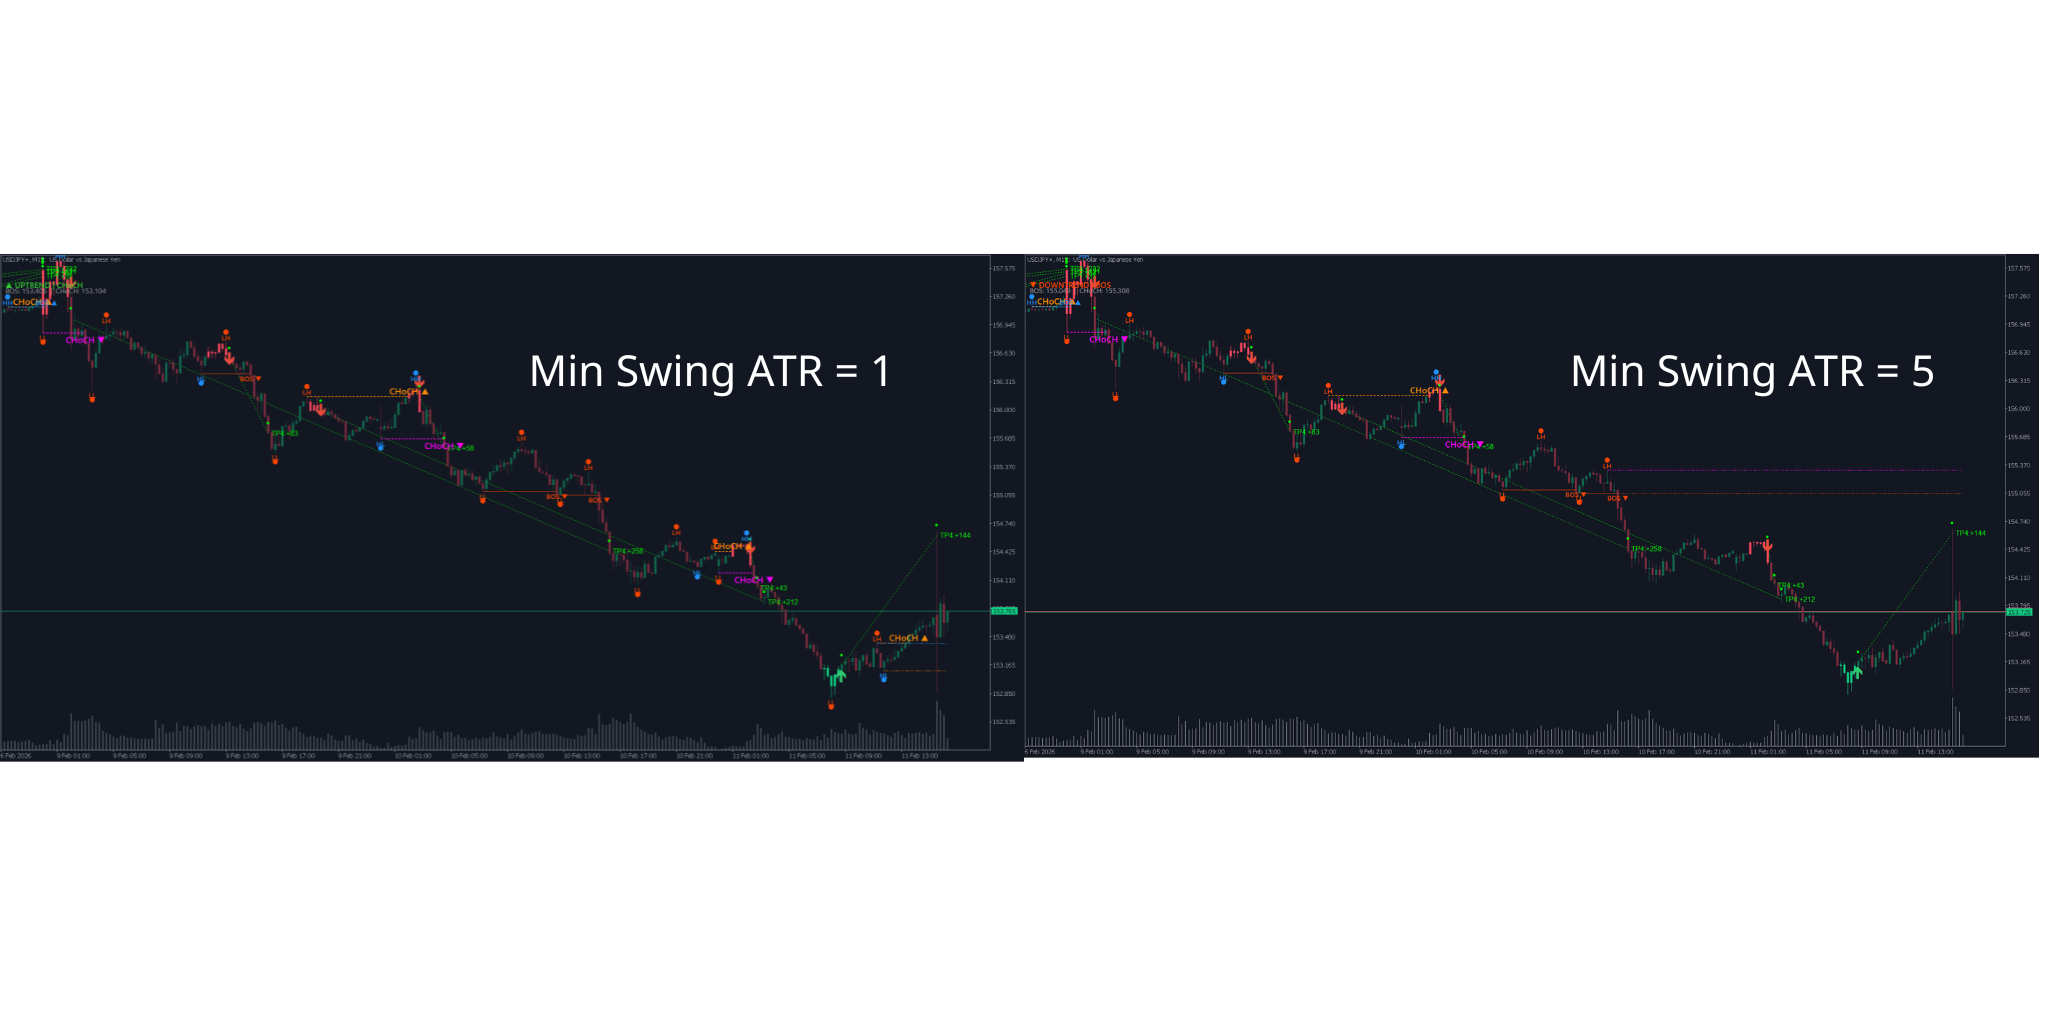
4. Min Swing ATR — Minimum swing size (ATR multiplier)
| Info | Details |
|---|---|
| Name in indicator | Min Swing ATR (0=AutoTune) |
| Default | 0.0 (automatic) |
| Range | 0.0 to 5.0 |
| Unit | ATR multiplier (×ATR) |
Meaning: The minimum distance between adjacent swing high and swing low must be at least Min Swing ATR × ATR to be considered a valid swing. If set to 0 , the indicator automatically calculates a suitable threshold.
When changing it:
-
0.0 (AutoTune) → the indicator analyzes data and selects an optimal threshold (recommended).
-
Increase (0.8, 1.0, 1.5...) → keeps only large swings → fewer swings but more meaningful.
-
Decrease (0.3, 0.5...) → keeps small swings too → more swings, more sensitive to short-term movement.
Example: ATR = 50 pips, Min Swing ATR = 1.0 → swing amplitude must be ≥ 50 pips to be shown.
Tip: Keep 0.0 (AutoTune). If your chart shows too many small swings, try increasing to 0.5–1.0.
5. Display parameter group (Show/Hide)
| Parameter name | Default | Meaning |
|---|---|---|
| Show Swing Markers | true | Show/hide circular markers at swing highs/lows |
| Show Swing Lines | true | Show/hide connecting lines between highs and between lows |
| Show Swing Labels (HH/HL/LH/LL) | true | Show/hide text labels classifying swings |
| Show BOS/CHOCH Lines | true | Show/hide horizontal lines at BOS/CHoCH locations |
| Show BOS/CHOCH Labels | true | Show/hide “BOS” / “CHoCH” text labels |
Tip: If your chart already has many indicators, you can disable Show Swing Lines and Show Swing Markers to reduce clutter, and keep only Show BOS/CHOCH Lines + Labels — that’s the most important information.

6. CHoCH Confirm Bars — Number of candles to confirm reversal
| Info | Details |
|---|---|
| Name in indicator | CHoCH Confirm Bars (1=instant) |
| Default | 2 |
| Range | 1 to 5 |
| Unit | Number of candles (bars) |
Meaning: When price breaks structure against the trend (a reversal sign), the indicator requires a certain number of consecutive candle closes beyond the break level to confirm it as a real CHoCH.
When changing it:
-
1 (instant) → CHoCH is confirmed as soon as 1 candle closes beyond → fast but more false signals.
-
2 (default) → needs 2 closes → balanced speed and reliability.
-
3–5 → needs more confirmation → very reliable but more delayed.
Real example: In an uptrend, price breaks below the latest low. If CHoCH Confirm = 2, the indicator waits for one more candle close below that low, then prints “CHoCH ▼” (potential bearish reversal).
Tip: 2 works for most cases. If you scalp on M1–M5, you may use 1 . If you swing trade on H4–D1, use 2–3 .

7. CHoCH Min Break — Minimum break distance for CHoCH
| Info | Details |
|---|---|
| Name in indicator | CHoCH Min Break (×ATR, 0=off) |
| Default | 0.0 (off) |
| Range | 0.0 to 2.0 |
| Unit | ATR multiplier (×ATR) |
Meaning: Besides requiring a close beyond the level, price must also break by a minimum distance (ATR multiplier) to count as CHoCH. This filters “tiny breaks” that quickly reverse (fake breaks).
When changing it:
-
0.0 (off) → no minimum distance required → more sensitive.
-
Increase (0.1, 0.3, 0.5...) → requires a stronger break → fewer fake CHoCH, but slower.
Example: ATR = 50 pips, CHoCH Min Break = 0.3 → price must break at least 15 pips (0.3 × 50) beyond the old swing level to count as CHoCH.
Tip: Keep 0.0 if you already use CHoCH Confirm Bars = 2 or higher (stacking filters can make signals too delayed). Enable it only if you want an extra filter in very noisy markets.
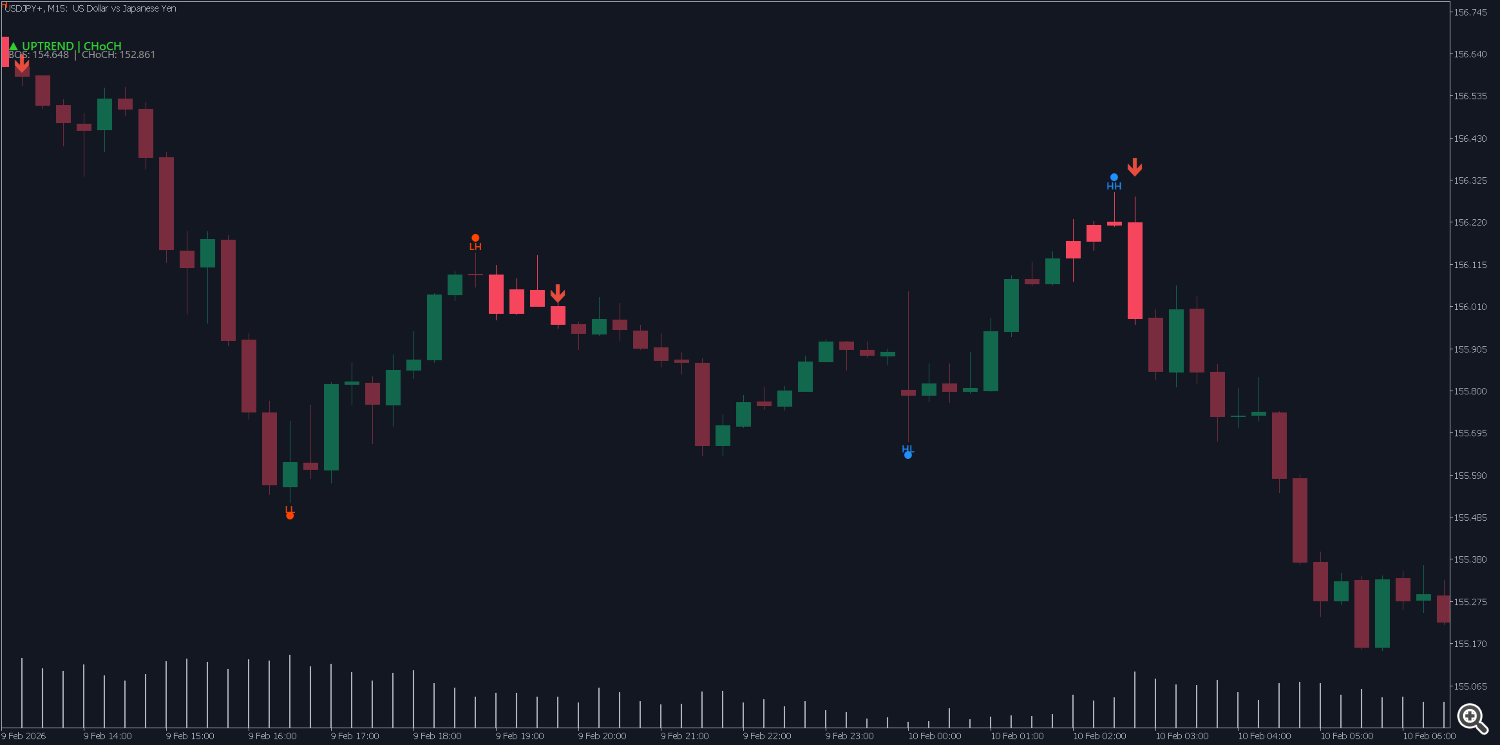
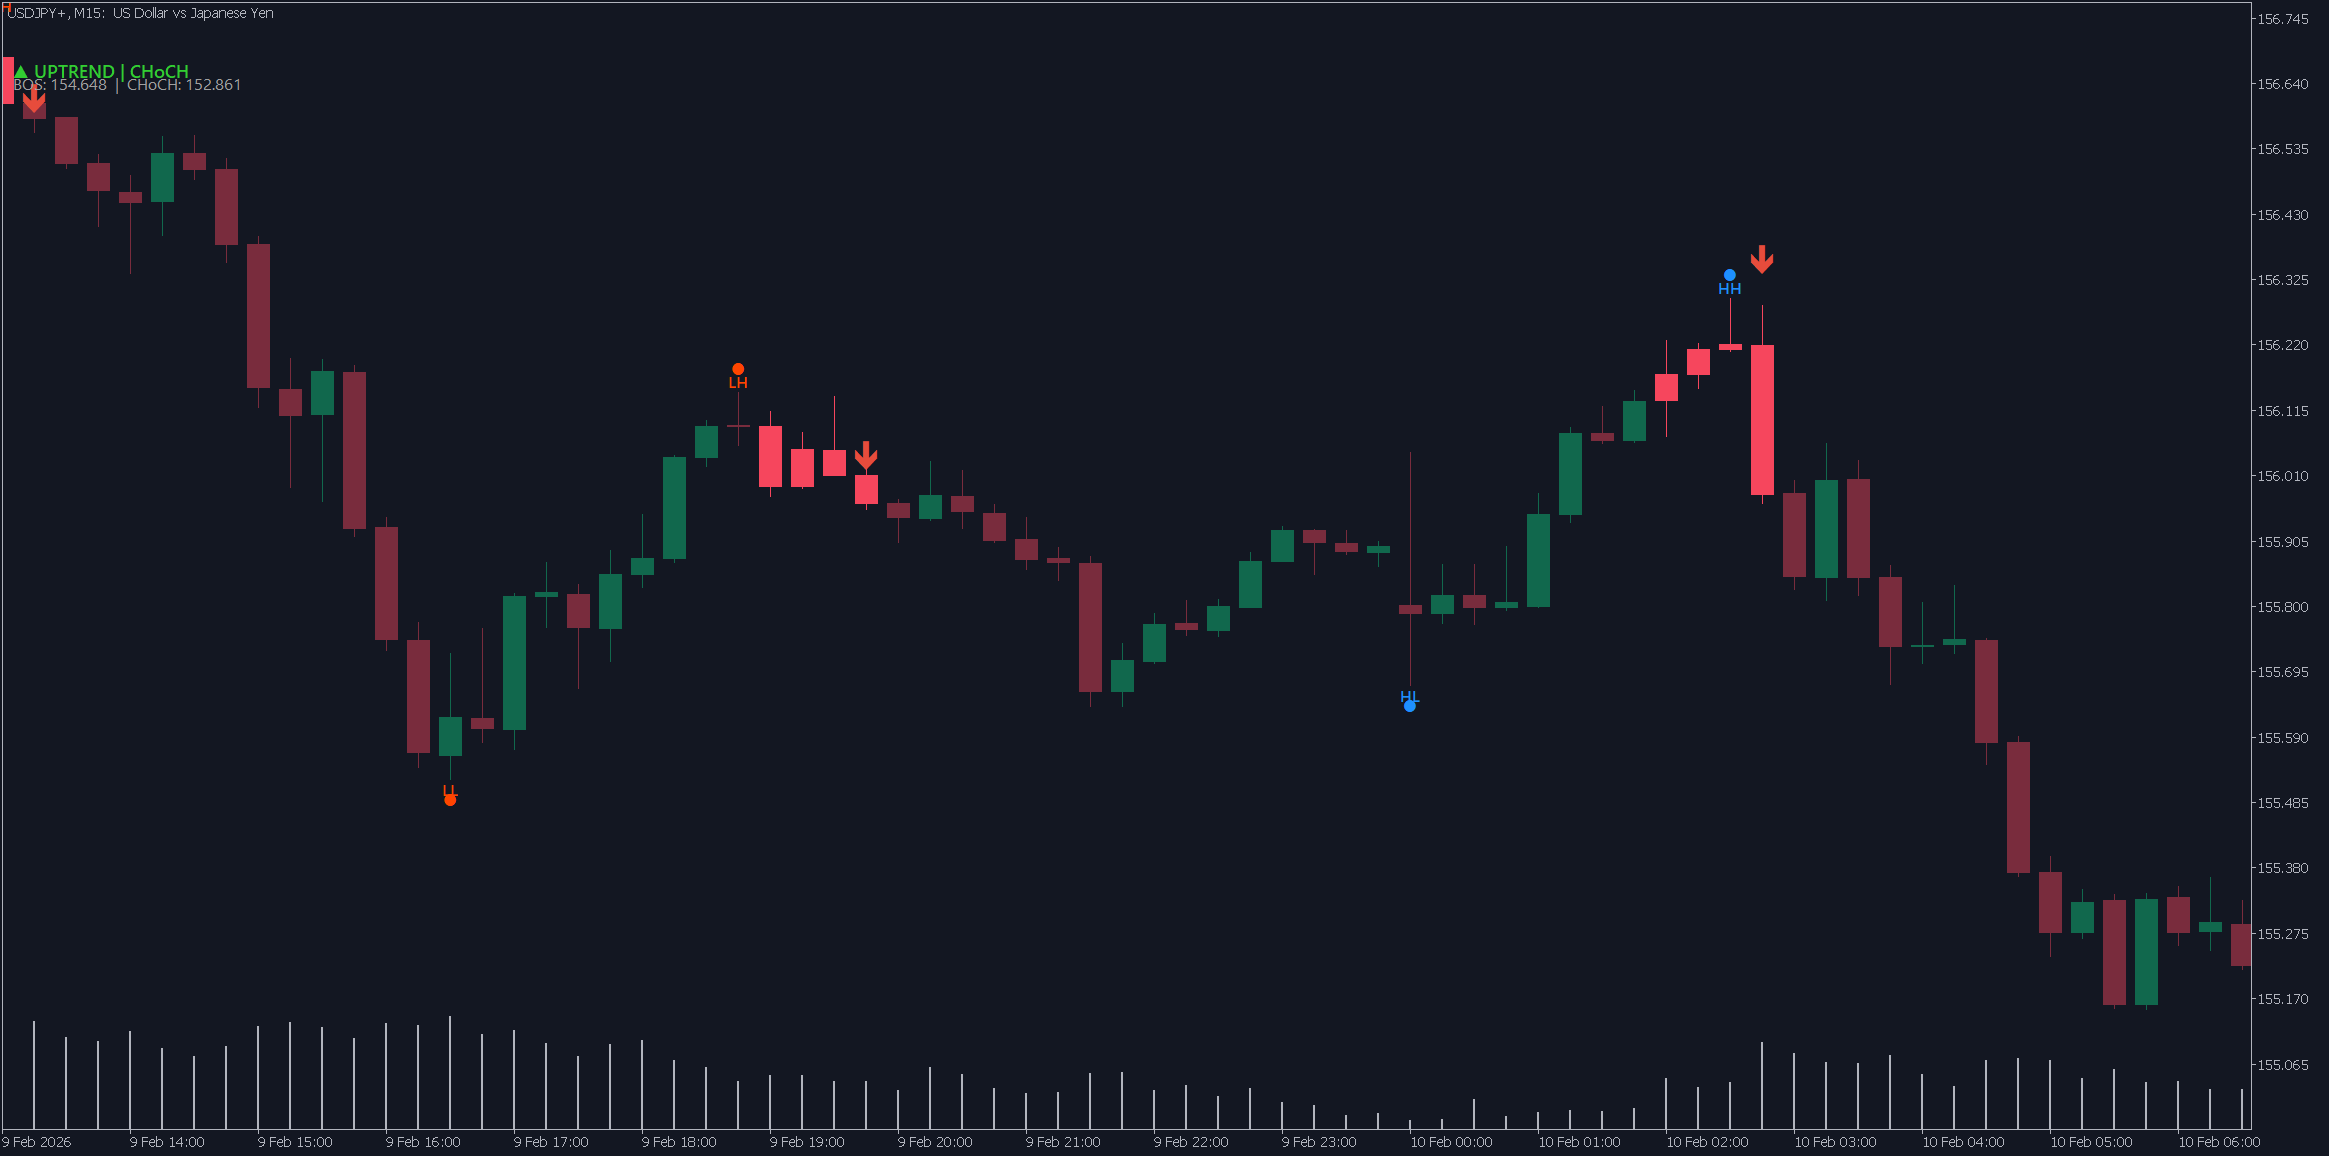
Reading signals on the chart
Swing markers (dots)
-
Dot above a candle = Swing High
-
Dot below a candle = Swing Low
-
Blue = swing in bullish direction
-
Orange/Red = swing in bearish direction
-
Gray = the latest swing (not enough data yet for comparison)
HH / HL / LH / LL labels (swing labels)
| Label | Meaning | Trend signal |
|---|---|---|
| HH (Higher High) | A high higher than the previous high | Uptrend |
| HL (Higher Low) | A low higher than the previous low | Uptrend |
| LH (Lower High) | A high lower than the previous high | Downtrend |
| LL (Lower Low) | A low lower than the previous low | Downtrend |
Swing lines
-
Dotted lines connect highs to highs, and lows to lows
-
Blue = bullish direction (HH or HL)
-
Orange/Red = bearish direction (LH or LL)
-
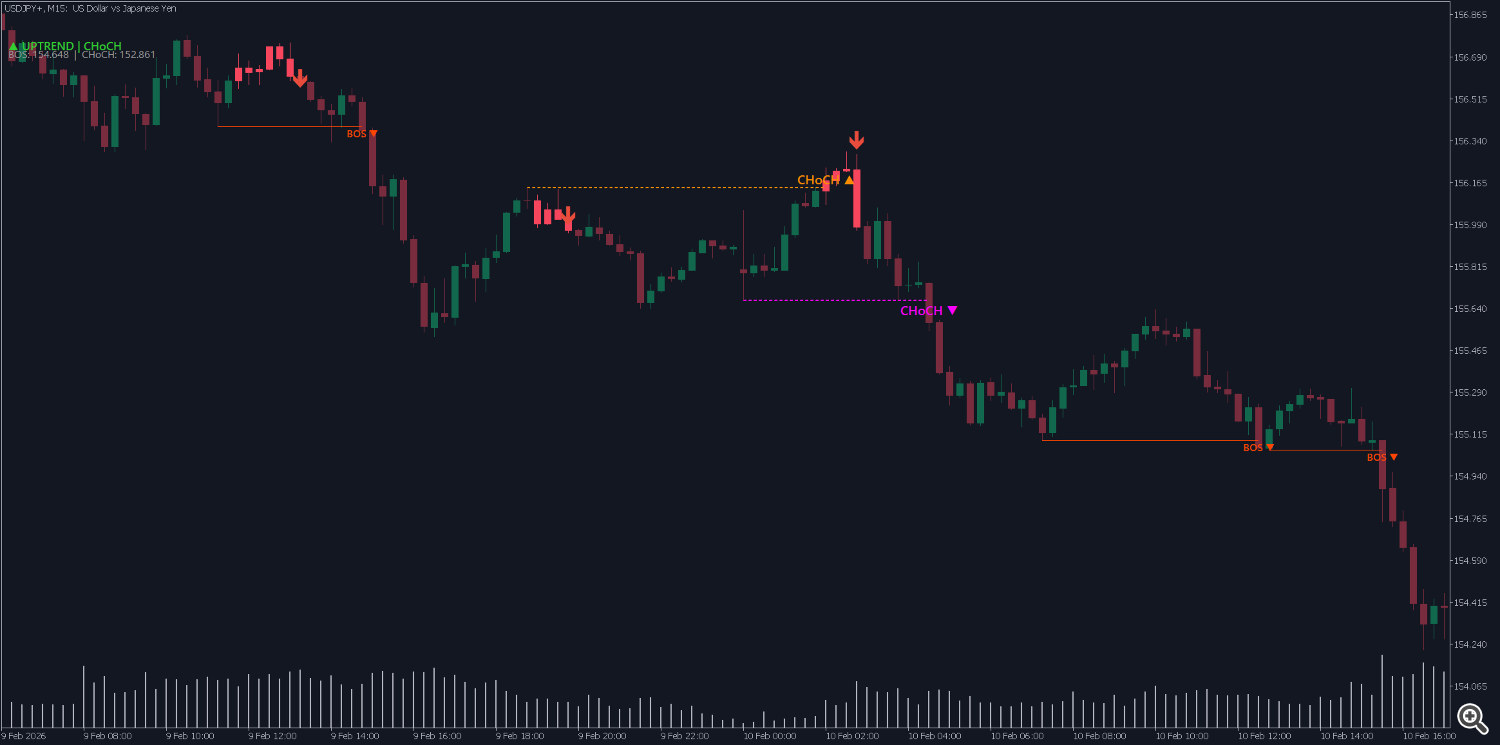
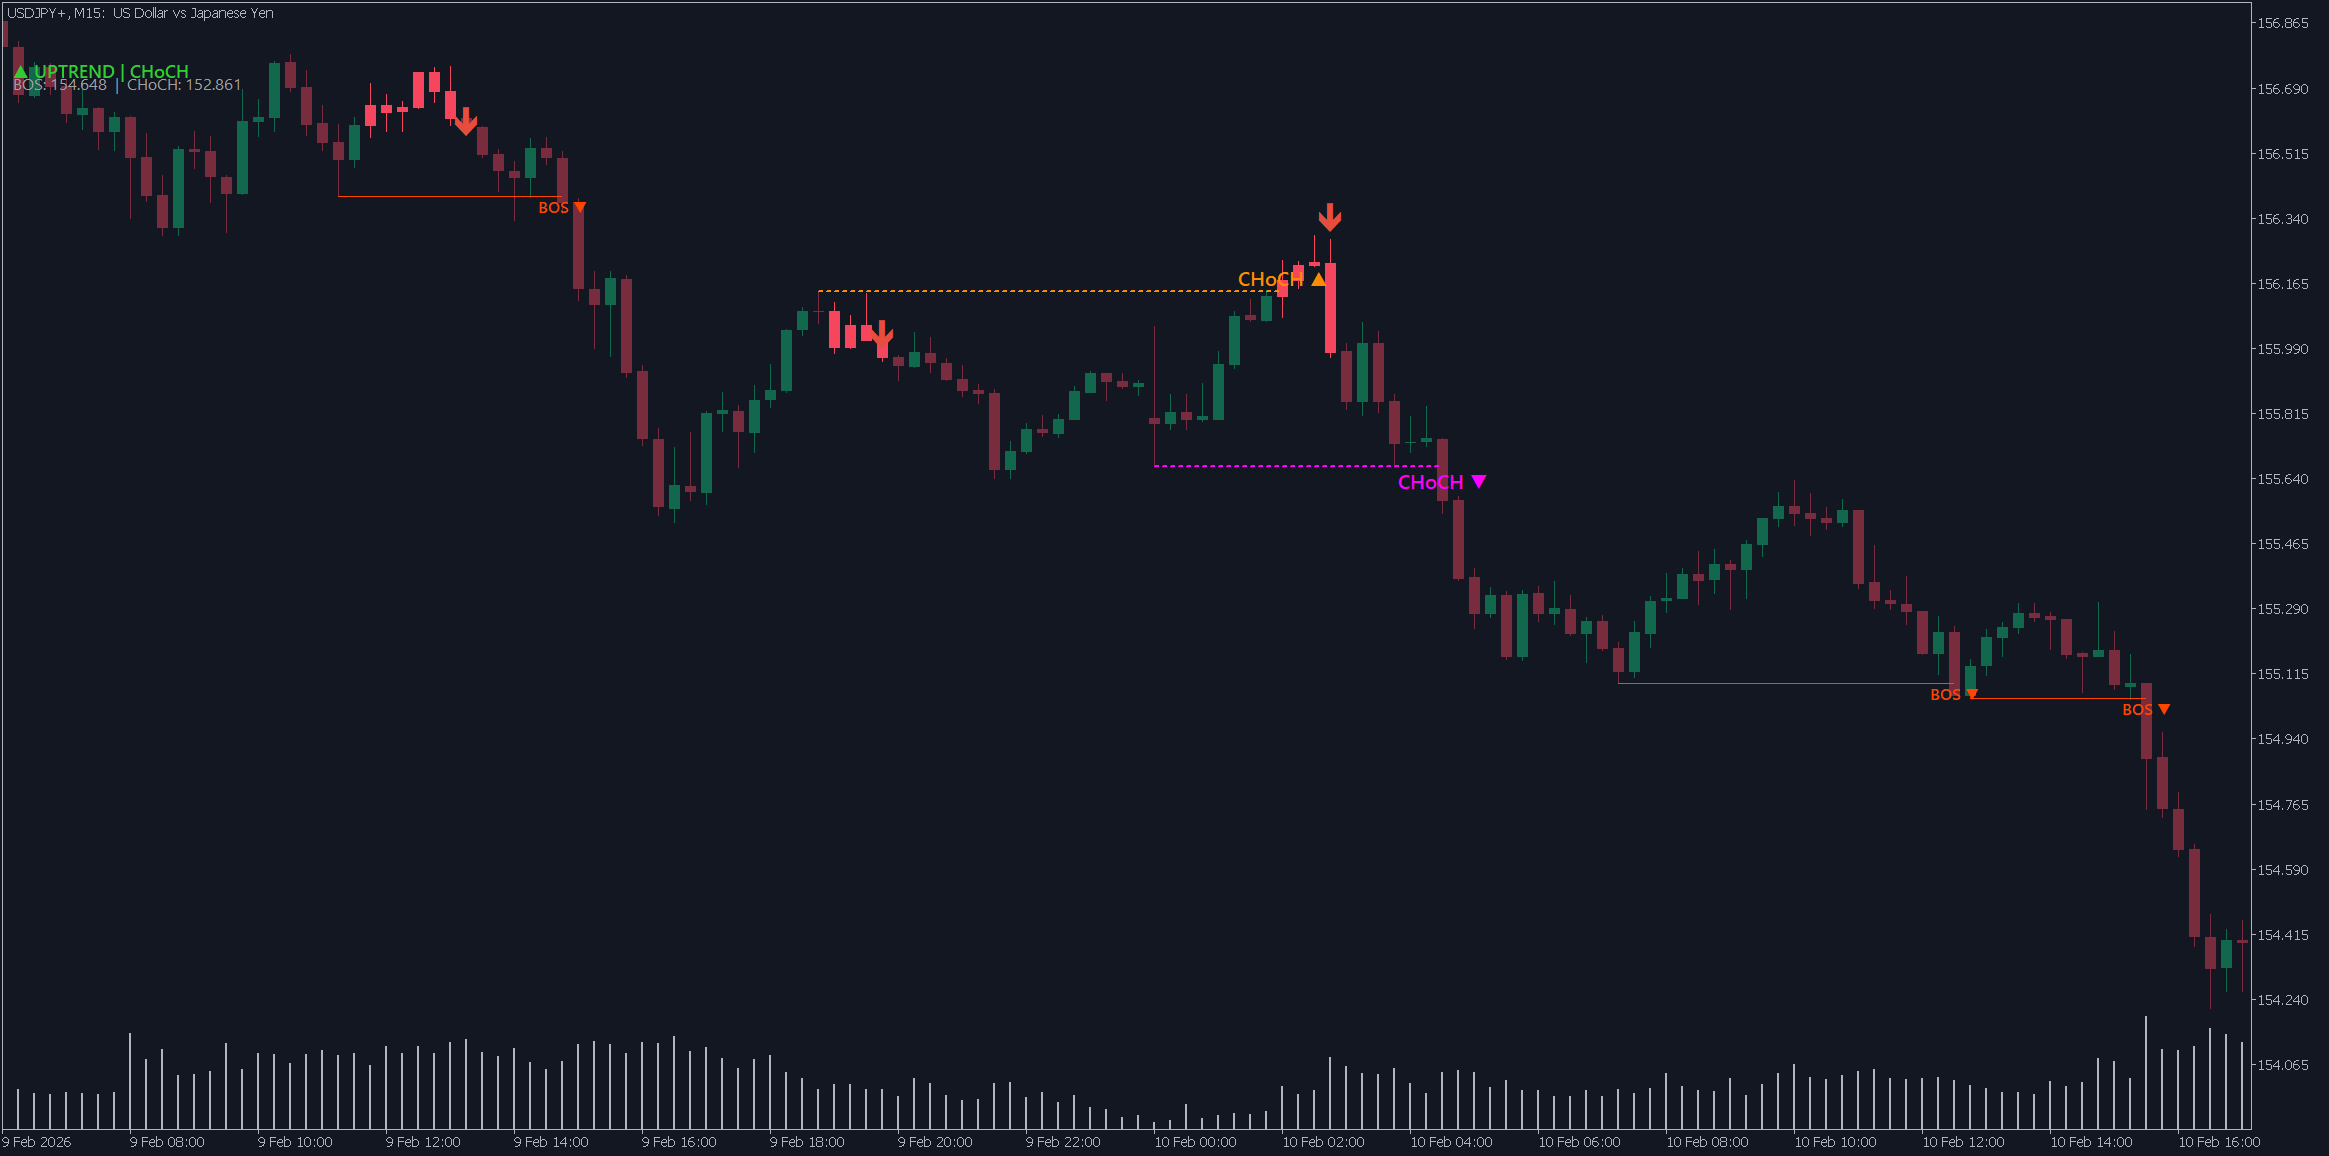
BOS / CHoCH labels
| Label | Color | Meaning |
|---|---|---|
| BOS ▲ | Blue | Bullish break of structure → uptrend continues |
| BOS ▼ | Orange/Red | Bearish break of structure → downtrend continues |
| CHoCH ▲ | Dark orange | Potential reversal from downtrend to uptrend |
| CHoCH ▼ | Pink/Purple | Potential reversal from uptrend to downtrend |
BOS / CHoCH event lines (horizontal lines)
-
Horizontal line extends from the broken swing point to the breakout candle
-
BOS: solid line, thinner
-
CHoCH: dashed line, thicker (because it is more important)
Critical levels
-
Dash-dot line extends to the current candle
-
BOS level: if price breaks this level → trend continuation
-
CHoCH level: if price breaks this level → potential reversal
Status panel (top-left corner)
-
Line 1: ▲ UPTREND , ▼ DOWNTREND , or ◆ RANGING + last event (BOS/CHoCH)
-
Line 2: the specific BOS and CHoCH price levels
-
Trading scenarios (examples)
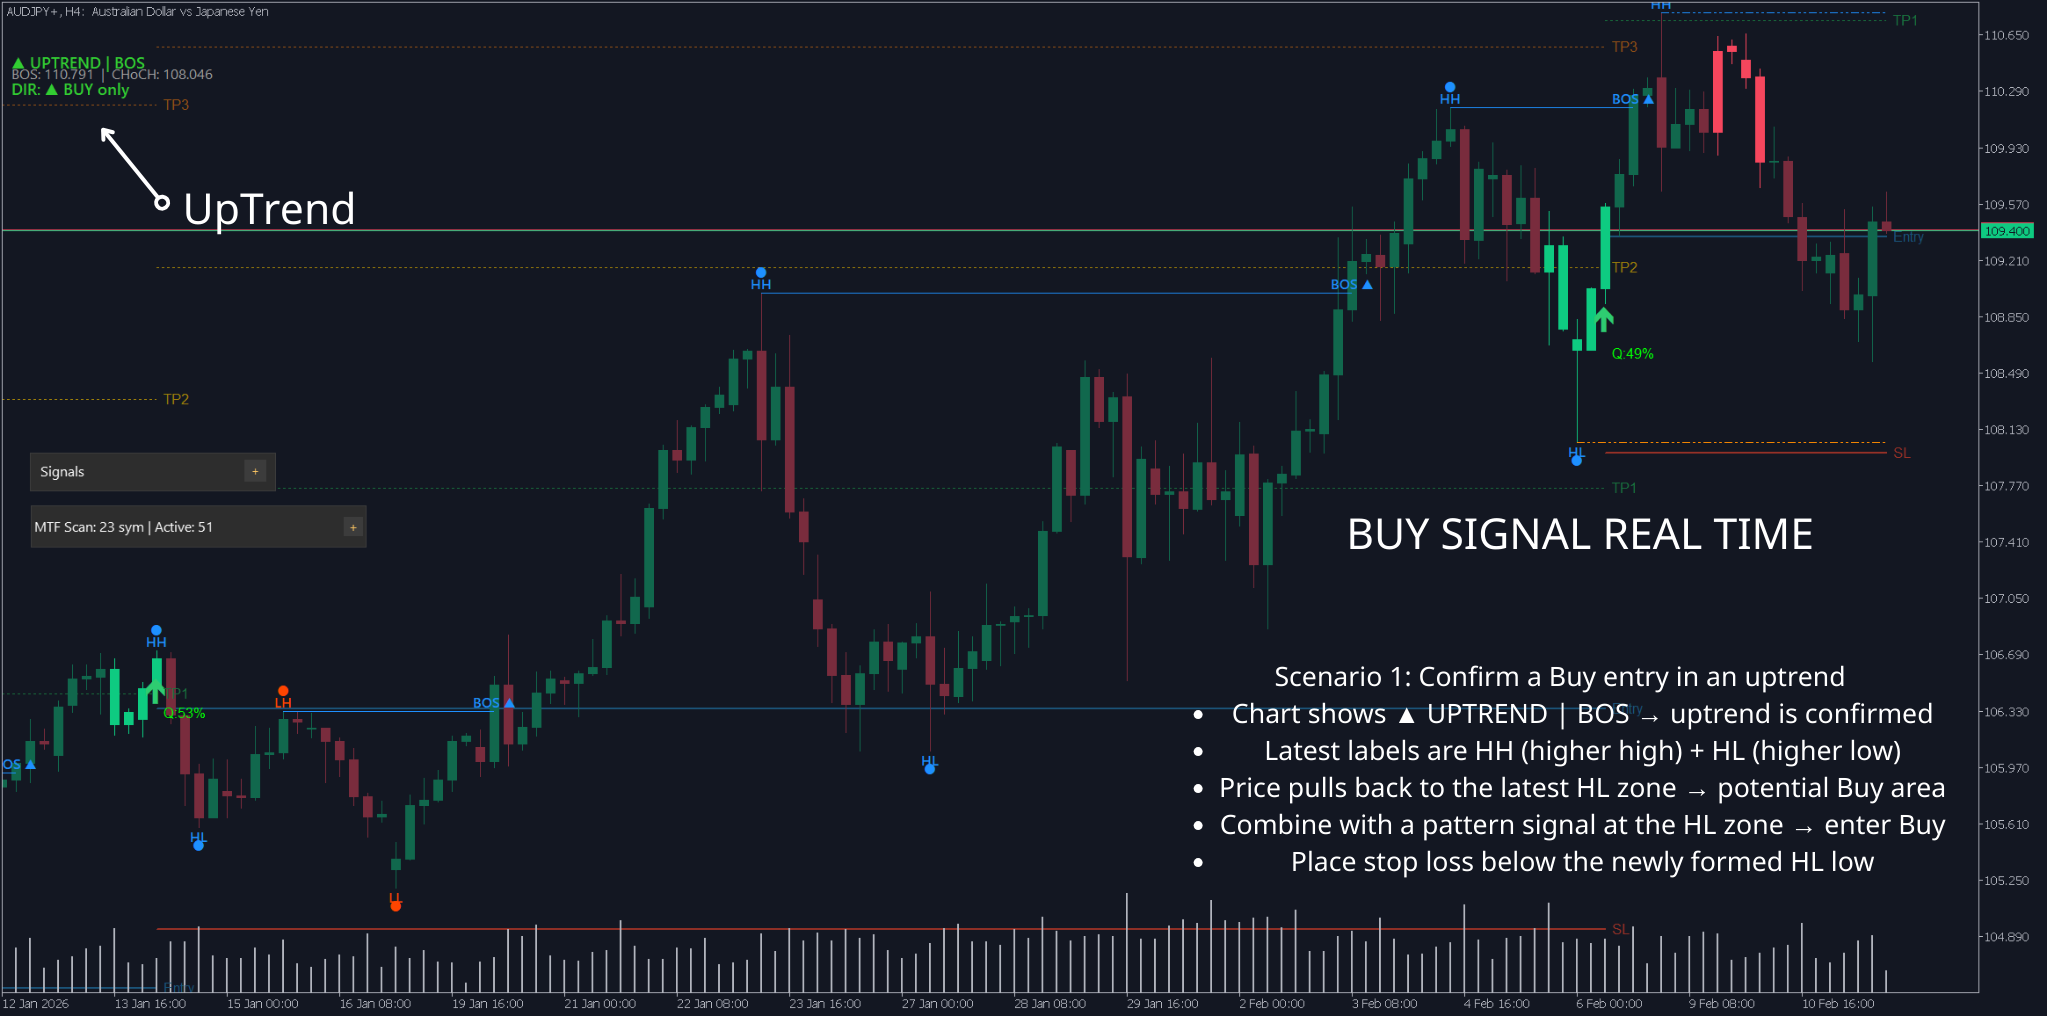
Scenario 1: Confirm a Buy entry in an uptrend
-
Chart shows ▲ UPTREND | BOS → uptrend is confirmed
-
Latest labels are HH (higher high) + HL (higher low)
-
Price pulls back to the latest HL zone → potential Buy area
-
Combine with a pattern signal at the HL zone → enter Buy
-
Place stop loss below the newly formed HL low
Scenario 2: Reversal warning — avoid entering
-
Market is in ▲ UPTREND , and a CHoCH ▼ label appears (pink/purple)
-
This warns the uptrend may be ending
-
You should not open new Buy trades at this moment
-
Wait for further confirmation: if a BOS ▼ appears afterward → downtrend is confirmed → look for Sell opportunities
-


Scenario 3: Sideways market
-
Status shows ◆ RANGING
-
Swing labels alternate inconsistently: HH then LL, etc.
-
Best approach: avoid trading, or trade within the range only (buy low, sell high) with small targets
Practical tips
Noise filtering
-
Avoid trading against structure: If Market Structure shows UPTREND + BOS ▲ → prioritize Buy, reduce Sell trades.
-
Wait for BOS confirmation after CHoCH: CHoCH is only an “early sign” of reversal; wait for BOS in the new direction before trading the reversal direction.
-
Avoid major news sessions: unusually strong volatility can create fake CHoCH. During NFP, FOMC, etc., avoid relying on structure for decisions.
-
Use a higher timeframe to confirm: If H1 is UPTREND but H4 is DOWNTREND → prioritize H4 (higher timeframe is usually more reliable).
Risk management
-
CHoCH is not an immediate reversal trade: It’s an early warning; don’t rush to Sell when you see CHoCH ▼ without extra confirmation.
-
BOS on a small timeframe can be noise on a higher timeframe: A BOS ▲ on M5 may be only a small fluctuation inside an H1 downtrend.
-
Signals are delayed by design: Because it needs candle-close confirmation (Confirm Bars), signals always appear after the event. This is intentional to reduce false signals — not a bug.
-
Always combine with patterns: Market Structure tells you the direction, patterns (Fakey, PinBar, Inverted Hammer) tell you the entry point. Using both is more effective than using either alone.
Optimize by trading style
| Style | Fractal Bars | CHoCH Confirm | CHoCH Min Break | Notes |
|---|---|---|---|---|
| Scalp (M1–M5) | 0 or 2 | 1 | 0.0 | Need fast reaction, accept more noise |
| Intraday (M15–H1) | 0 (AutoTune) | 2 | 0.0 | Balanced speed and accuracy — recommended for most |
| Swing (H4–D1) | 3–5 | 2–3 | 0.1–0.3 | Strong filtering, keeps only large swings and clear CHoCH |
Quick summary
| If you want to... | Do this |
|---|---|
| See the current trend | Look at the top-left: ▲ UPTREND / ▼ DOWNTREND / ◆ RANGING |
| Know the trend may reverse | Find a CHoCH label (dark orange or pink/purple) on the chart |
| Confirm trend continuation | Find a BOS label (blue or orange/red) |
| Find a Buy entry zone | Wait for price to pull back to the HL zone in an uptrend |
| Find a Sell entry zone | Wait for price to pull back to the LH zone in a downtrend |
| Reduce noise on small charts | Increase Fractal Bars or set a higher Timeframe |
| Reduce fake CHoCH | Increase CHoCH Confirm Bars to 2–3 |


