
Cluster of synergistic trading systems based on a Moving average | Download a ready-made EA

A month ago, we began testing the GoldBaron expert advisor using the concept of synergistic trading systems. The results were impressive, but more extensive testing and refinement are needed. As an experiment, we assembled a similar automated cluster of systems based on our free "Moving Average Cross Signal" indicator. The "2MA BlackBox" automated expert advisor is available. Download the expert completely free of charge . There are no restrictions and the expert can be used on real accounts.
A huge thank you to the users who suggested improvements to the previous single module! We also appreciate the bugs and inaccuracies you found! Your feedback and opinions on this trading system are very important to us. Please share them via private messages or in the indicator comments.
To use the Expert Advisor, you need to download the free "Moving Average Cross Signal" indicator from the MQL Market and keep it in the MQL Market. The indicator file should be located in the "Indicators/Market" folder.
The expert advisor is configured for Gold (XAUUSD) on the H1 (1 hour) timeframe. However, you can use the expert advisor on any symbol and timeframe, after checking the results in the tester.
Now that you have everything you need to test the system's functionality yourself, let's move on to its description.
All subsystems are built using the same template: After the indicator's signal arrow appears upward, we place a pending BUY STOP order at a distance from the high of the bar that generated the signal. To exit the position, we use STOP LOSS, TAKE PROFIT, and TRAILING STOP. All values are expressed as a percentage of the current symbol price. We hold pending orders for only one bar (one hour in our case). If a position is open, no new positions are opened.
Trading system synergy: Systems are adjusted one by one in areas where previous systems performed poorly. To adjust, we identify weak points and increase the lot size in these areas. The lot size is increased only during adjustment; subsequently, all subsystems open the same volume.
Subsystems can open orders if there are already open ones from other subsystems.
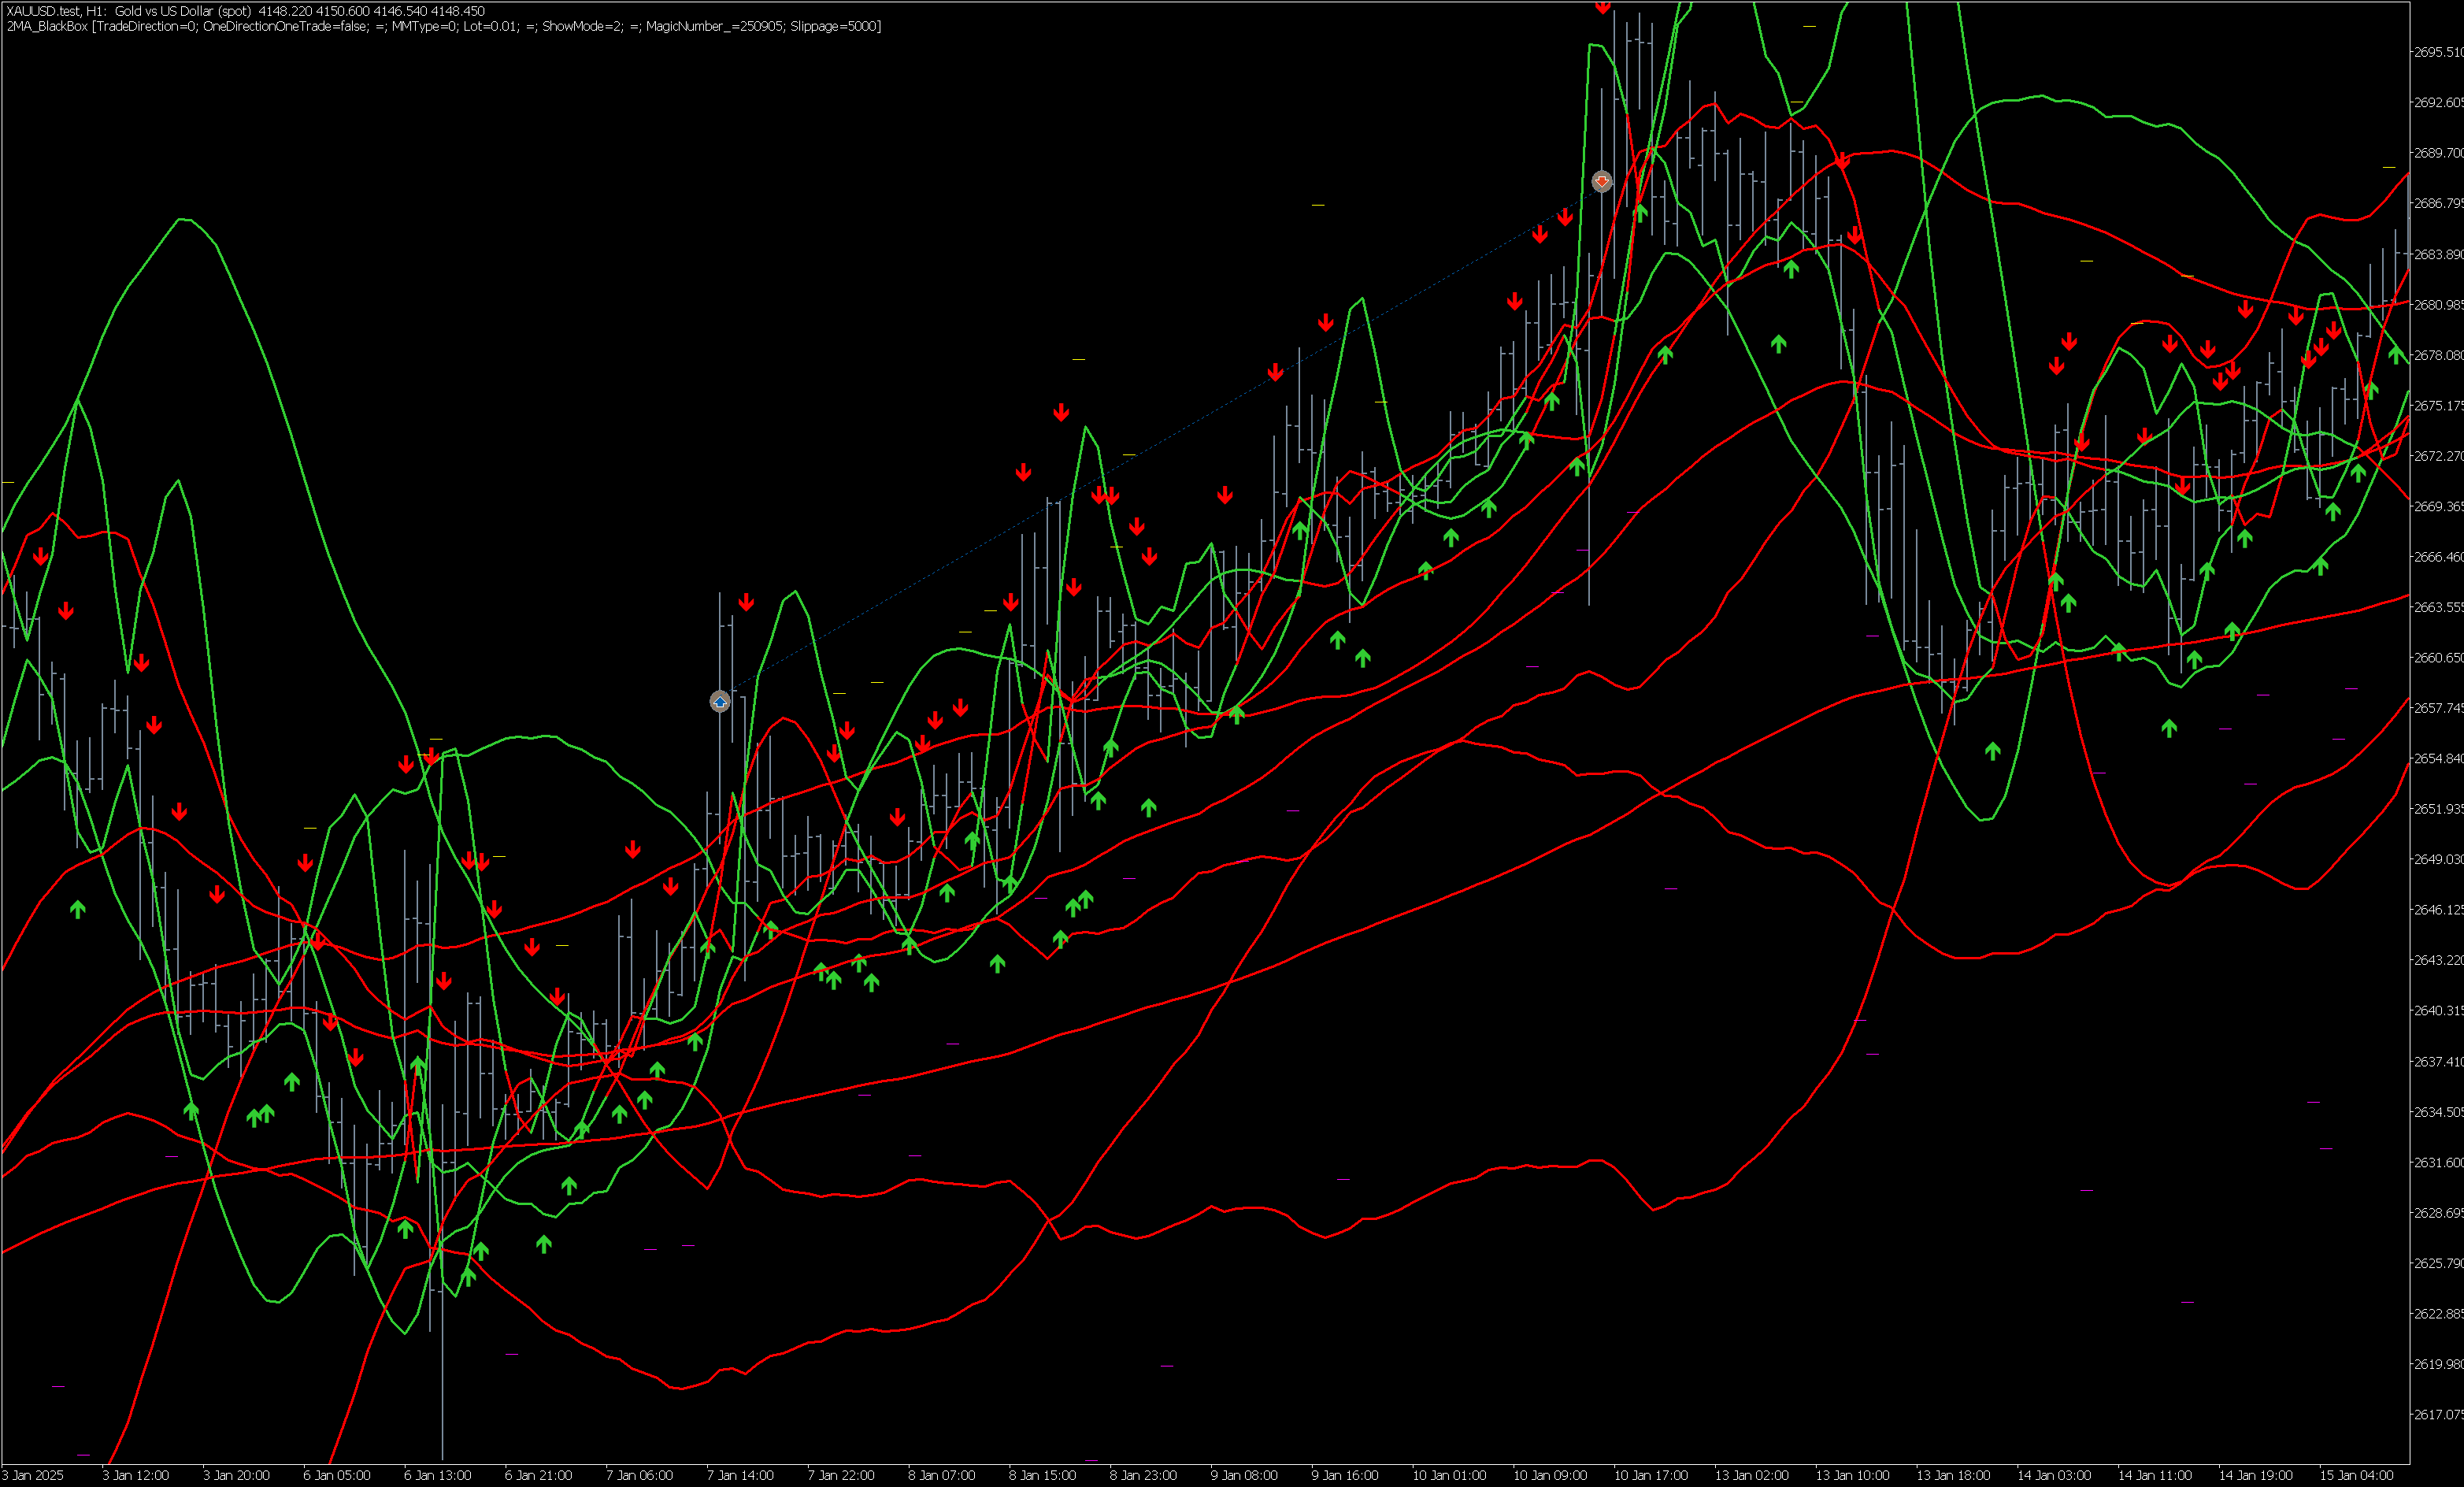
If you don't remove the indicators from the chart, it all looks terrible!
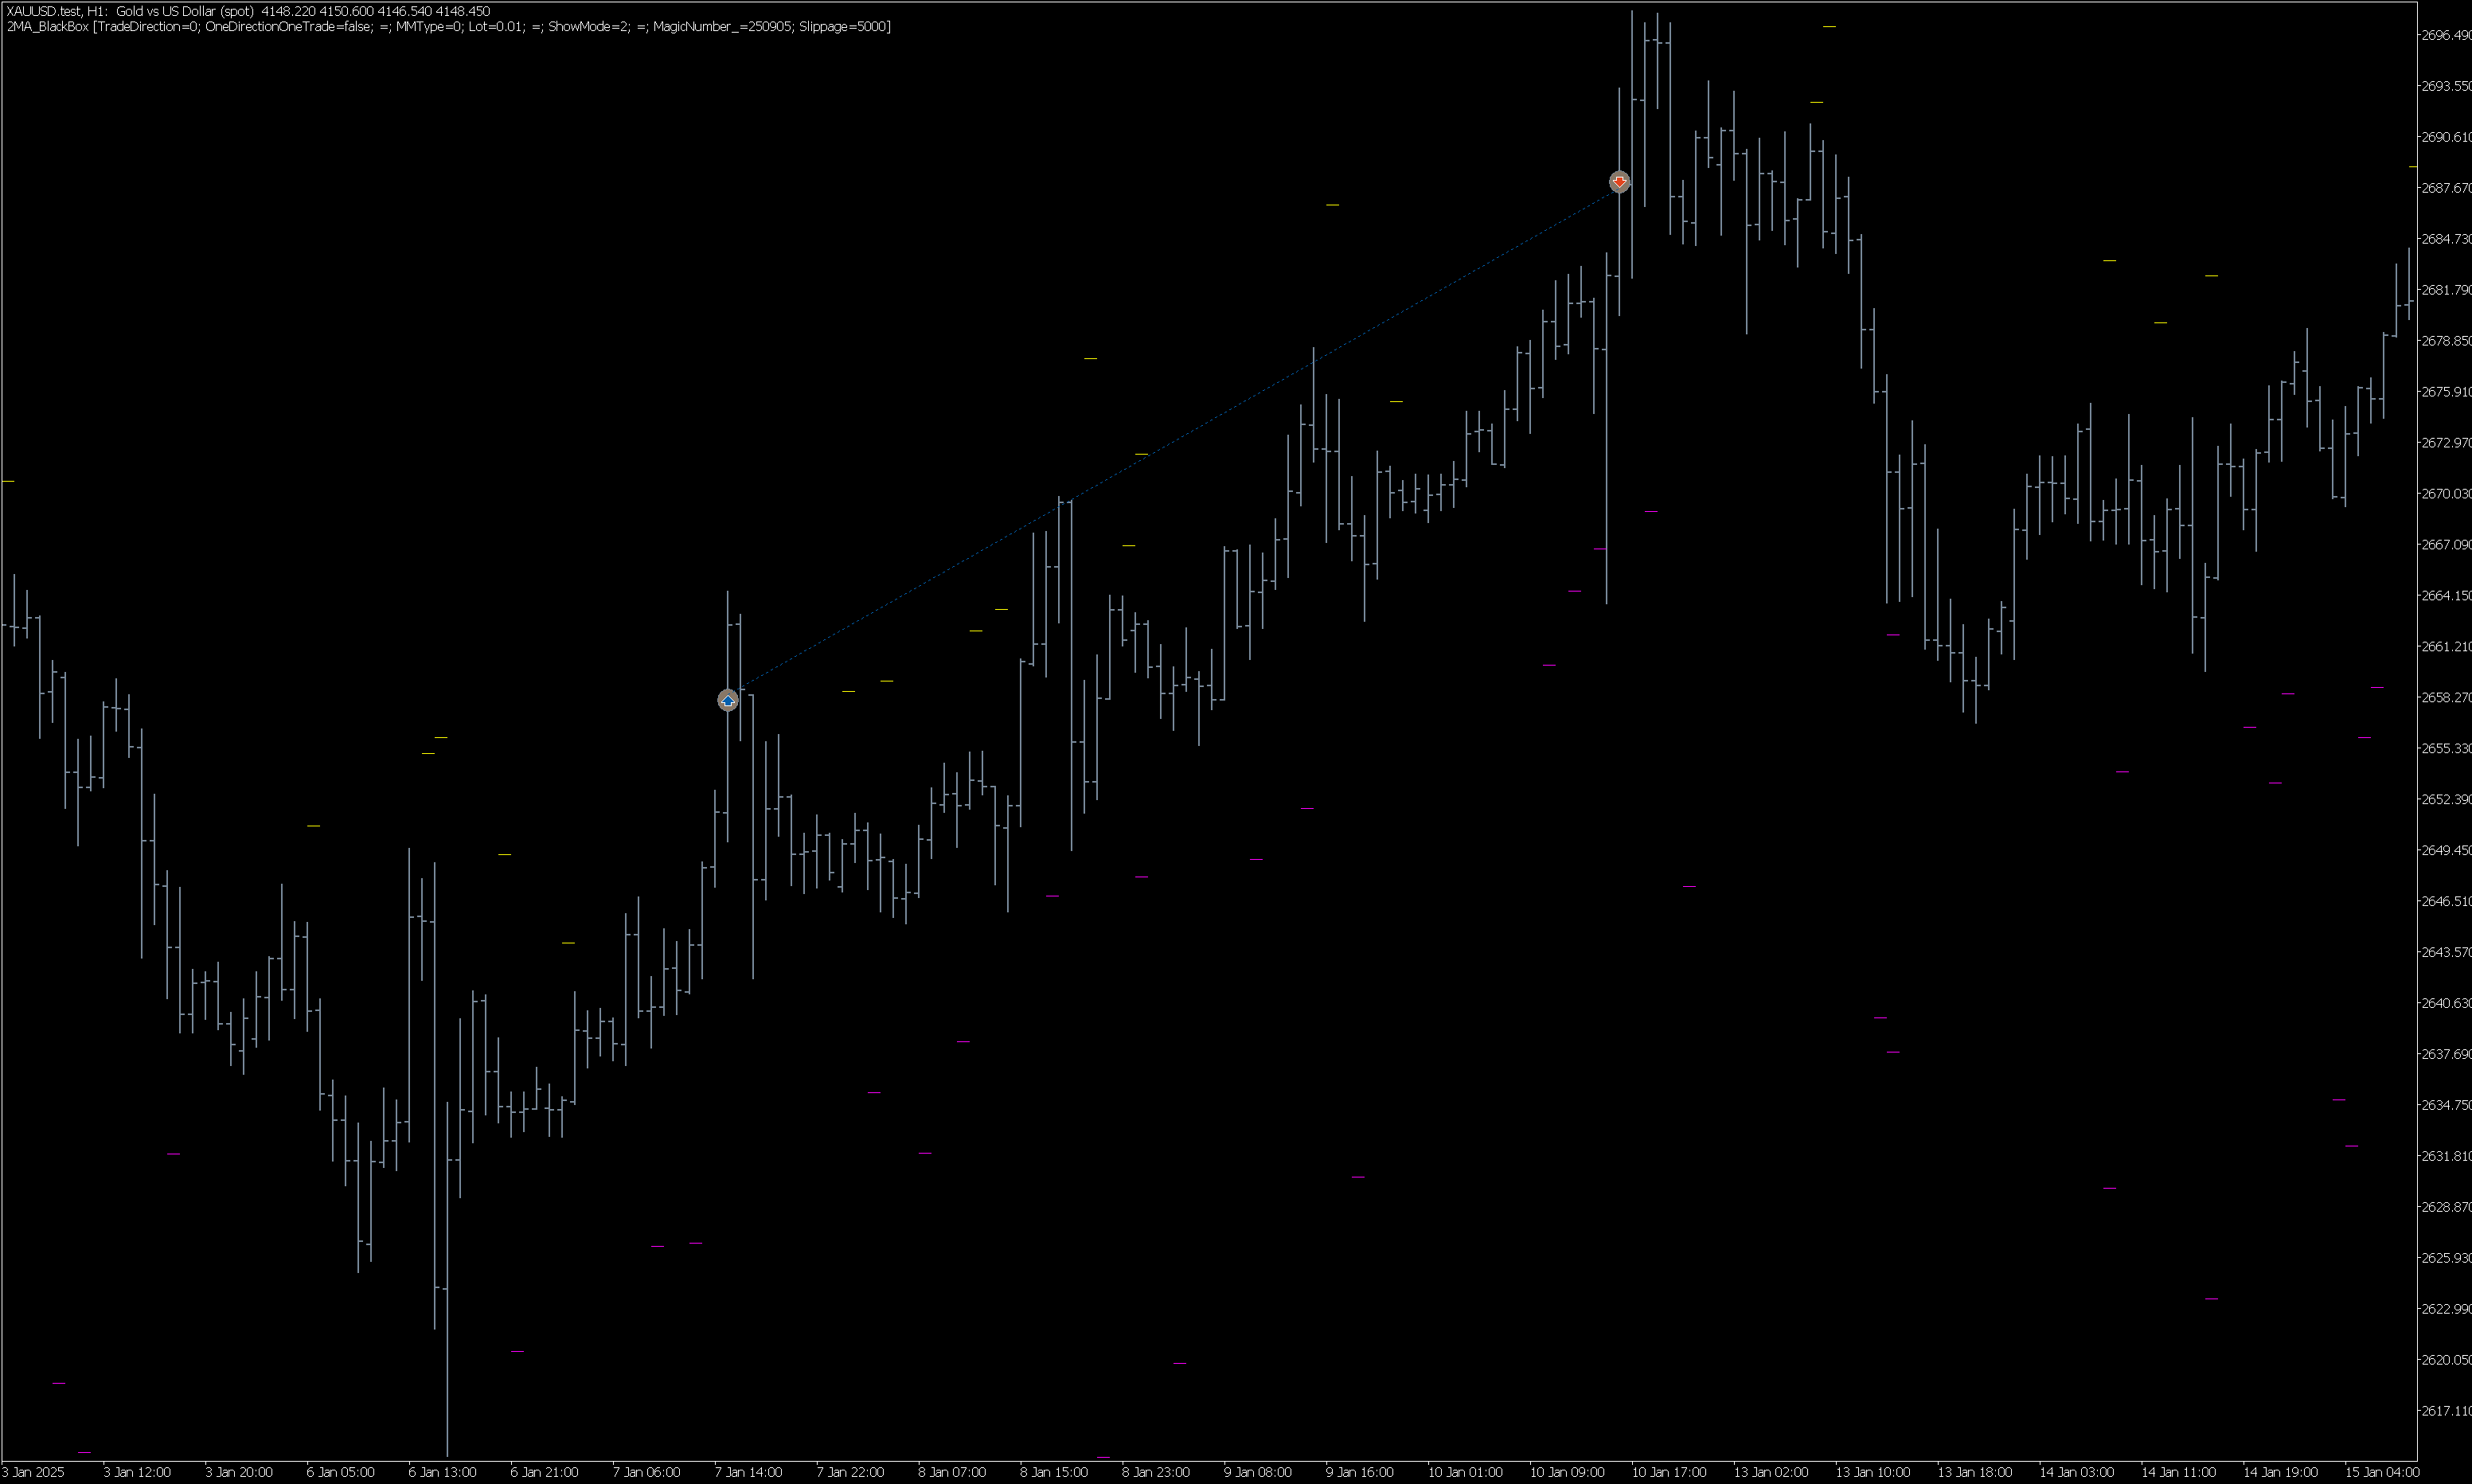
Things are looking better after removing the indicators! Yellow and purple dashes indicate failed stop orders.
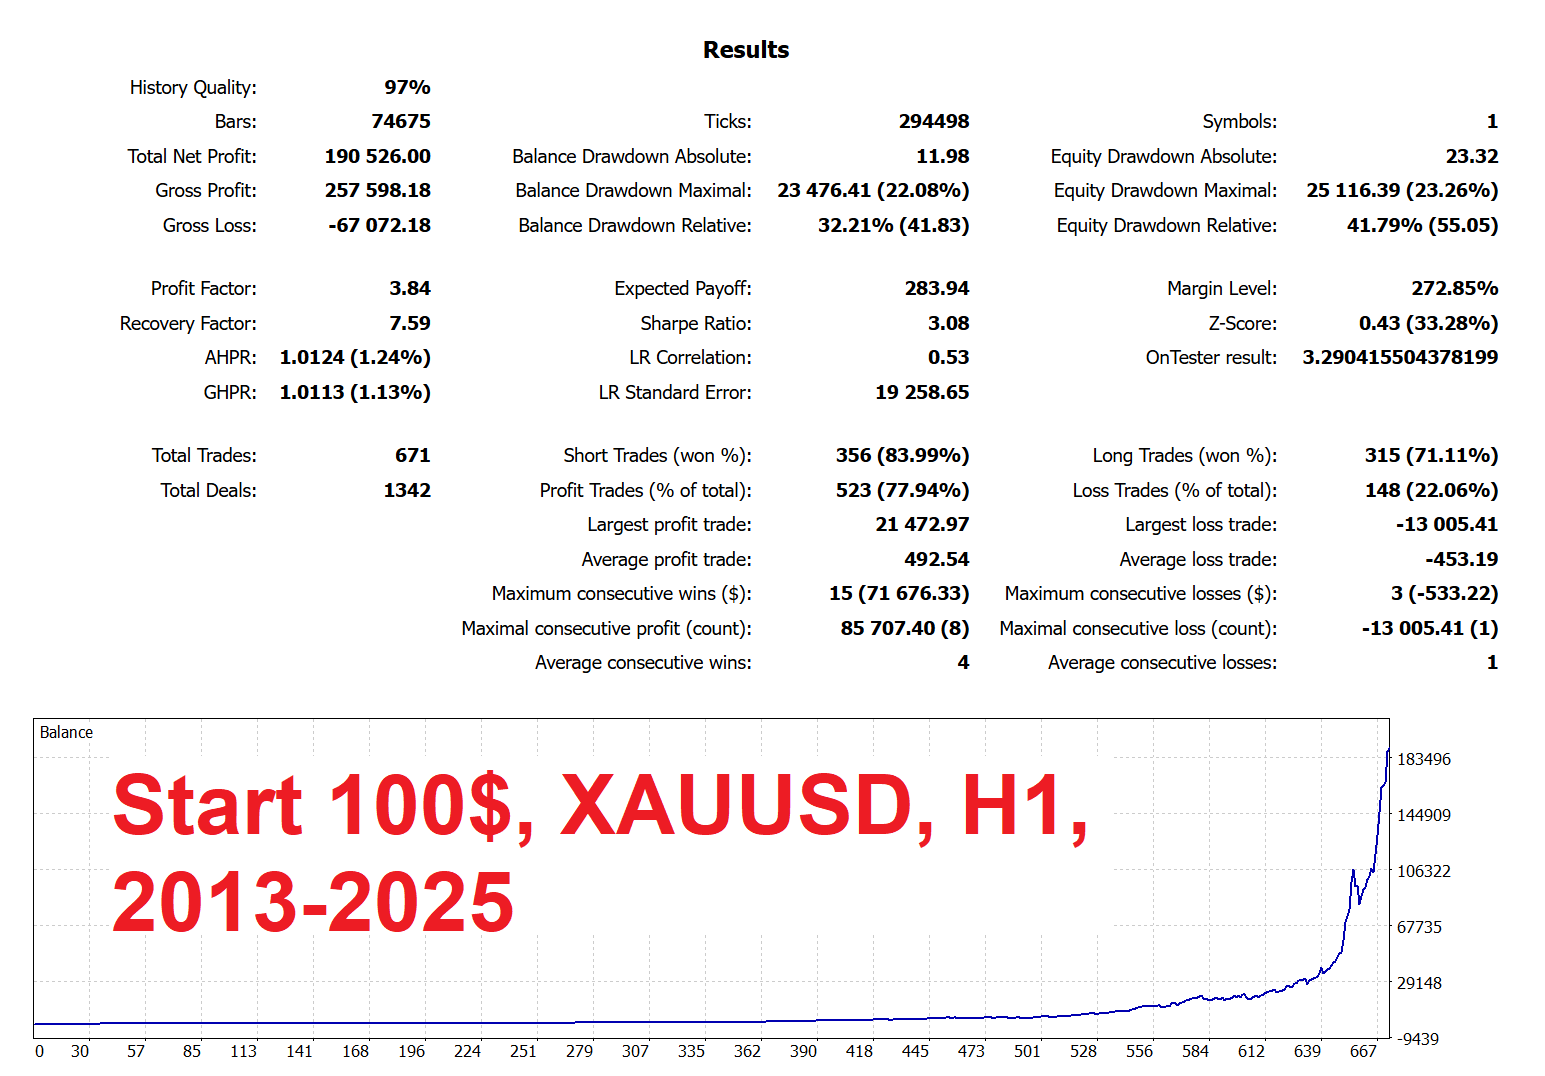
This is how the system works in the strategy tester.
Conclusions about the operation of the synergistic trading system
1. Positive aspects and strengths:
-
Synergy and diversification: The key idea behind the system is not simply using multiple copies of the indicator, but rather customizing them (possibly through different parameters or offsets) to operate in different market conditions. This allows the system to remain active in both trending and flat markets, where a single strategy could otherwise lead to losing streaks.
-
Automation and discipline: The system is fully automated, eliminating the emotional factor and strictly following the specified entry and exit rules.
-
Clear rules: The logic is transparent: indicator signal -> pending order placement -> order lifetime limit (1 bar) -> position management via Stop Loss, Take Profit, and Trailing Stop. This makes the system easy to test and replicate.
-
Visual confirmation of effectiveness: The strategy tester chart shows steady deposit growth with periods of correction, which is typical of a working trend-following system. The balance curve does not have any sharp, uncontrollable dips, indicating manageable risk.
2. Potential risks and areas for improvement:
-
Risk of "over-optimization": Adjusting systems in areas where previous systems performed poorly can lead to overfitting. A system may show excellent results based on past data, but fail to perform well in real trading on new data. Long-term and forward testing are required.
-
Complexity of analysis: As has been correctly noted, the simultaneous operation of several subsystems with indicators creates "visual noise", making it difficult to manually analyze and understand which subsystem is currently generating a signal.
-
Position accumulation and risk: The ability to open orders from different subsystems while positions are already open increases overall market exposure. During periods of high volatility or counter-trend movements, this can lead to significant simultaneous drawdowns across multiple positions. Careful monitoring of the system's behavior during such periods is required.
-
Dependence on price behavior on the 1-hour bar: The strategy of placing a pending order at a distance from the signal bar's high/low and its short lifespan (1 bar) makes the system sensitive to specific price behavior during the hour. A strong false breakout can lead to a series of unfilled orders or slippage.
3. Recommendations and conclusion:
Presented A cluster system based on the Moving Average Cross Signal looks extremely promising . It demonstrates the principle that diversification not across instruments, but across variations of a single strategy, can lead to sustainable results.
To switch to real accounts, we recommend:
-
Continue testing on the maximum available history, including periods of different market regimes (strong trends, prolonged flats, crisis events).
-
Conduct a forward test (testing on data unfamiliar to the system) on a demo account for at least 2-3 months.
-
Analyze the maximum drawdown (Max Drawdown) and make sure that its level is psychologically and financially acceptable for you.
Result: The team has done a great job of creating, testing, and, importantly, distributing the system freely. The results justify further in-depth study and refinement of the approach. This is an excellent example of the evolution from a simple strategy to a complex, yet more sustainable, synergistic system.


