
Creating a profitable strategy using the Advanced CCI by Ioannis Xenos robot
Prodoct link:
Introduction
The Advanced CCI trading robot provides users with absolute freedom to trade their preferred instruments their own way by observing and analyzing them. The main signal is derived from the CCI indicator, and the robot offers multiple options, such as trailing stop, dynamic lot size, trading session, MA filter, dynamic stop-loss levels, Kelly Criterion calculator, and more. This means that you can scalp, day trade, or engage in any other type of trading that suits your style.
While the robot offers several options to choose from, finding profitable strategies can be challenging initially. However, as the saying goes, "less is more," and you can discover hundreds, if not thousands, of profitable setups for each asset. In this article, we will analyze a setup that has been successful for the past two years on the EURUSD H1. We will keep things simple and provide you with the necessary tools to improve this strategy further.
The essential thing to keep in mind is that using this strategy provides you with complete control. You are not relying on an unknown strategy that may blow up your account one day without your knowledge. Instead, you will be able to pinpoint the cause of any possible drawdowns - which every healthy strategy must have - and adjust your strategy accordingly to adapt to the new market conditions.
Inputs
Let's now see the strategy together:
- Simple signal. Buy when the CCI crosses below -50 level (after the bar closes) and sell if the price crosses above the 50 level.
- Close any opposite open positions when a new signal appears.
- CCI Period set to 80. CCI method is set to Open Price.
- We will start with a Fixed lot size, and as the demo account starts with 10,000, we will check the 1.00 lot per trade. Later we will explore the Lot in Percentage using the built in Kelly Calculator.
- SL and TP methods will be calculated using the ATR. It will be 6 for both. That means that we will give space for both SL and TP levels around 6 bars above and below the entry price.
- We're also going to use a trailing stoploss. It's gonna be triggered after 100 points in profit, it will place the SL 50 Points below the current price - that means that if the trailing SL is triggered, we're in profit- and it is gonna have a step of 20.
- Maximum Buy and Sell orders at the same time will be 1. You can add more if you want.
- We're not gonna use a trading window or an MA filter. Probably we could try and avoid trading when the market has a breakout but in this case I'd like to see how it performs full time.
We're ready!
Results
Now let's split our results in half. Let's see these years separated.
First of all comes the graph. I always check the graph to determine if a strategy is good with the naked eye.
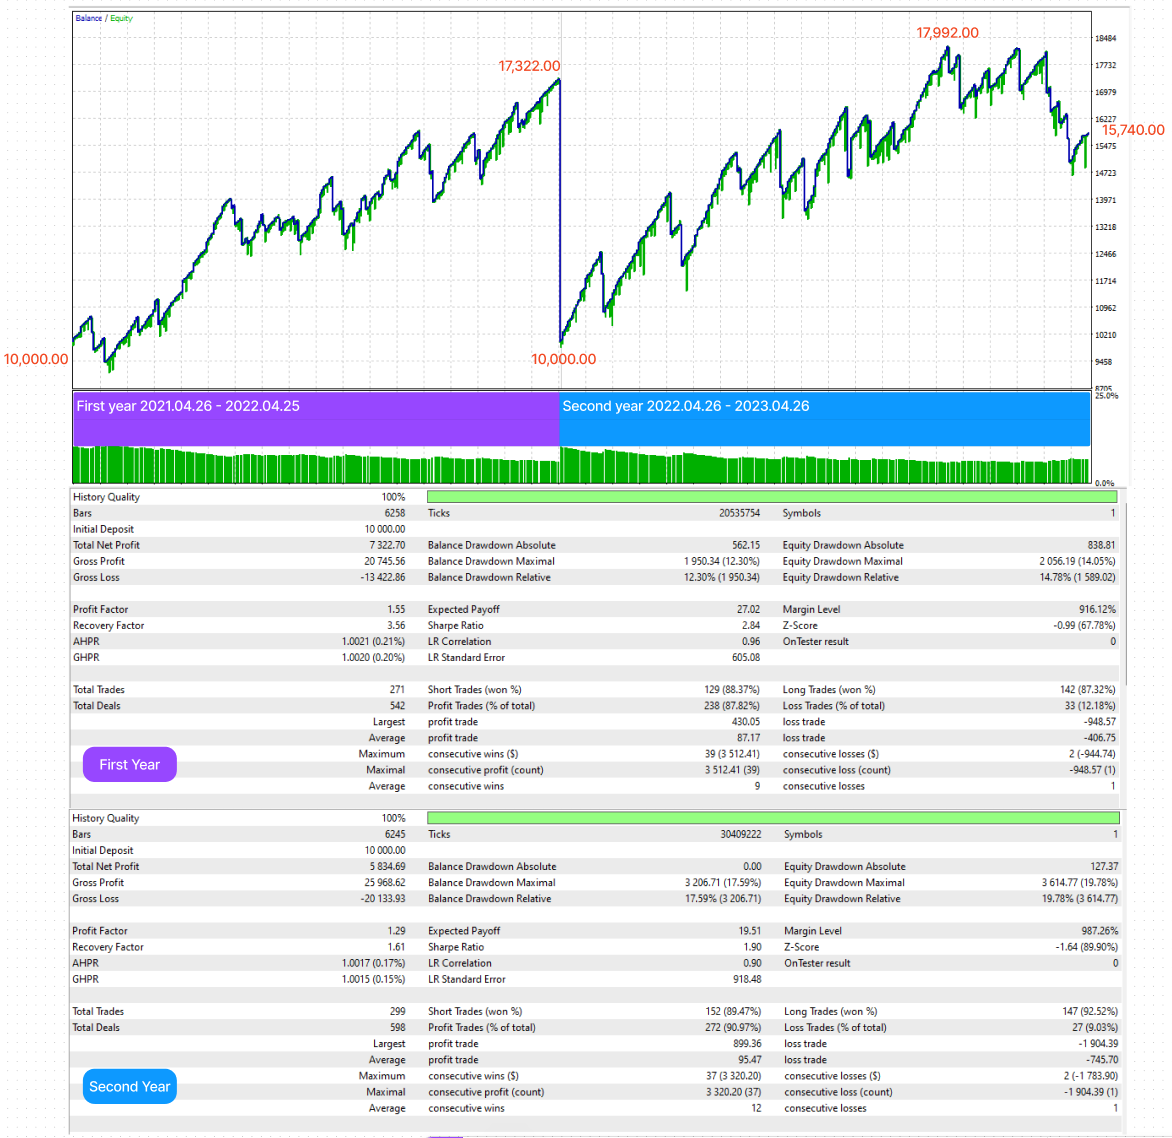
Now let's check the overall performance for these two years:
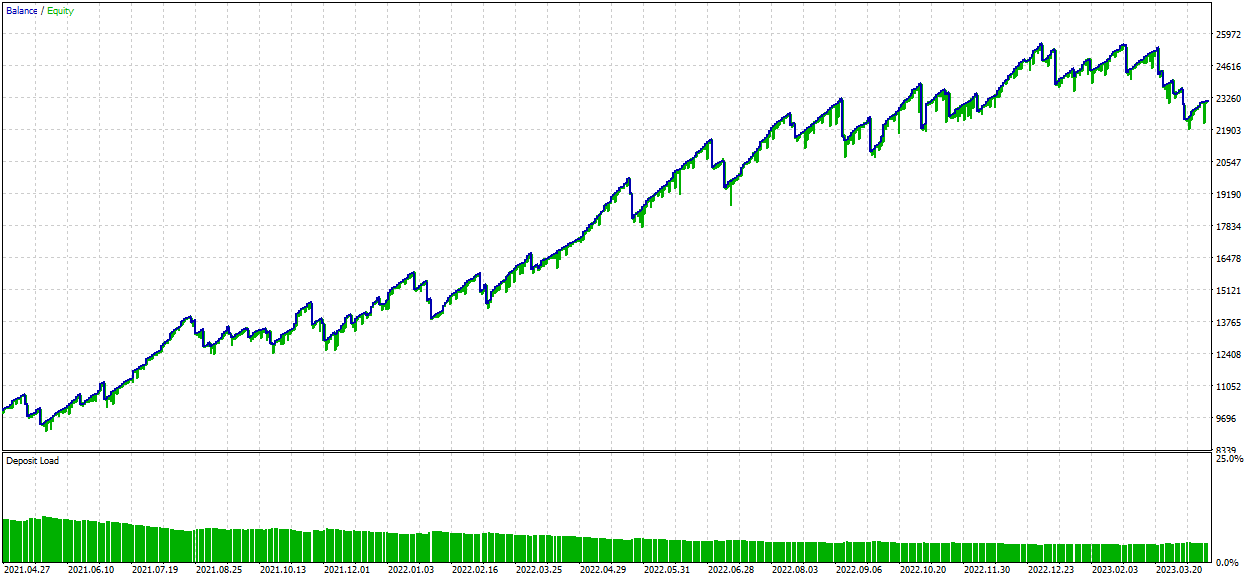

Kelly Calulator
But this result comes when we trade the same amount, no matter what our account balance is. Let's try a more dynamic way to calculate our lot size, risk and potential profit. As mentioned before, this EA comes with a built-in Kelly Criterion Calculator. Let's use it and combine it with the Lot in Percentage mode.
Before doing so, let's add our statistics on the Kelly Calculator. We need the possibility of winning and the ratio between the Profit and the Loss.
From the backtest we can see that the percentage of the profit trades is 89.47%. Also we can check the average profit trade and the average loss trade. If we make the division, the result is: 91.60/559.28 = 0.16.
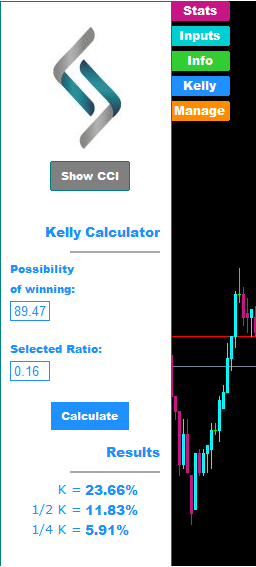
Kelly says that the optimal risk per trade is 23.66%. I have to admit that this is pretty high, and it is always recommended to use the fractions of Kelly, with the most commonly used to be the 1/4.
But from curiosity and only, let's check what is happening when we risk the full Kelly in each trade.

The "Lot Size" field in this case is not used.
Here are the results:
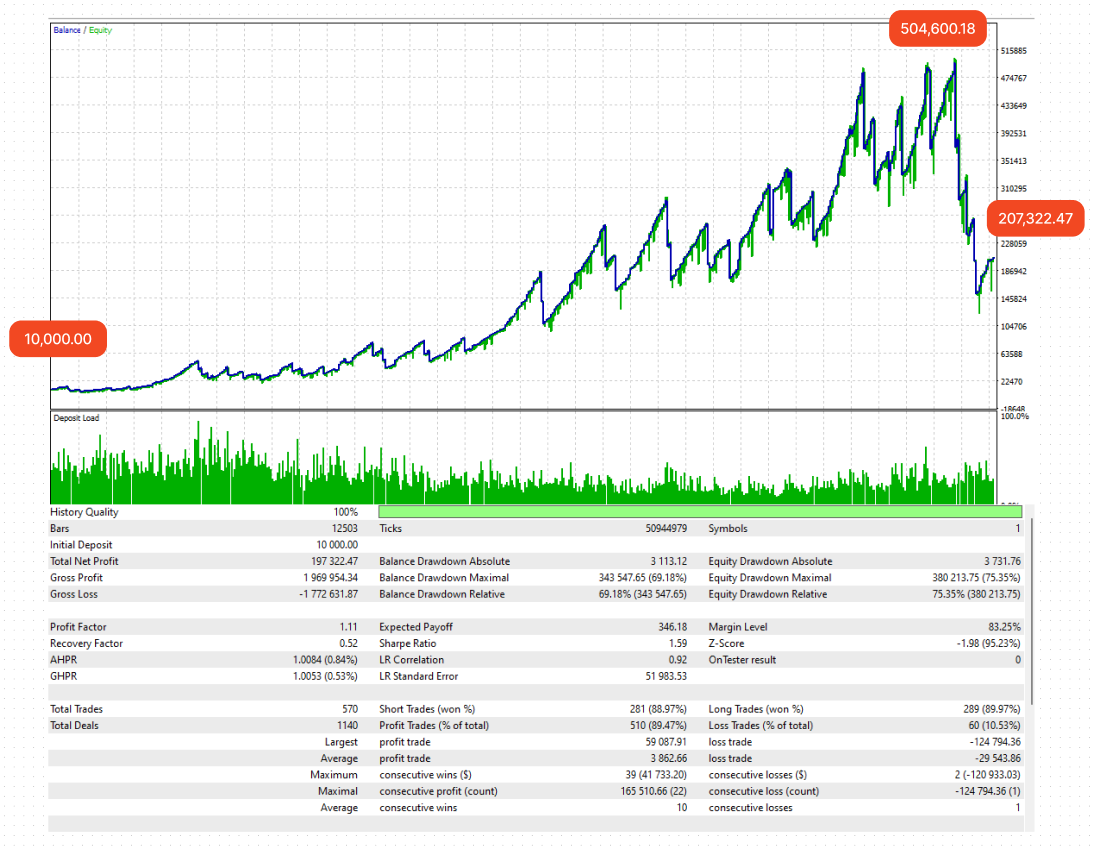
And now that we're scared enough from the recent drawdown, but also pumped up by seeing how powerful the Kelly Criterion could be, let's be disciplined and focus on the 1/4 Kelly that could probably have a great impact on our strategy.

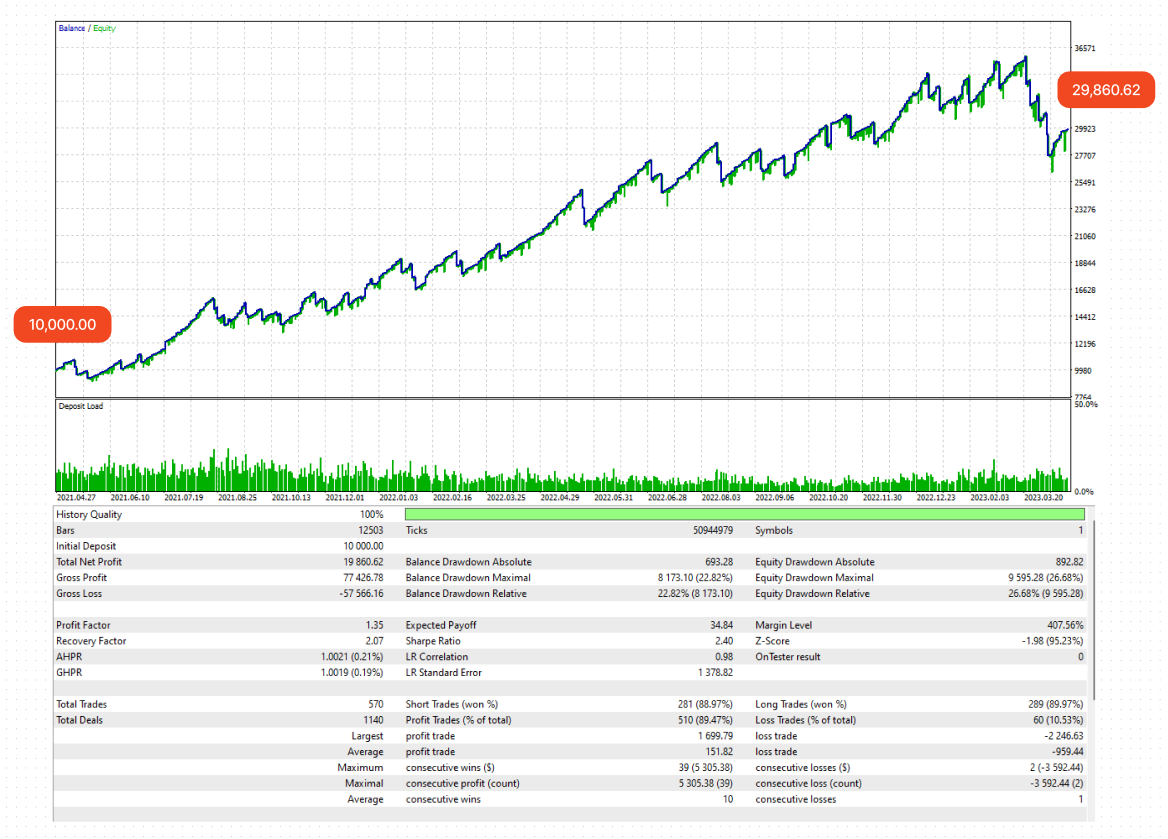
You can experiment with the 1/2 Kelly or other risk percentages to find your own unique setup. Playing around with different inputs, instruments, and timeframes can help you discover what works best for you.
Manage Tab
To help you secure your trading further, there's another built-in functionality available in the "Manage" tab. There are two different ways to manage your risk. The first is a % daily stop, where you can select a percentage of your daily account balance (it changes every day on broker's time or GMT time -you can change it from the inputs), and if this percentage is reached, the robot will stop trading for the rest of the day.
Secondly, there's another stop you can use. Simply select a specific amount (if you don't like math and percentages), and if the account equity drops below this amount, the robot will stop trading until it is reactivated by the user.
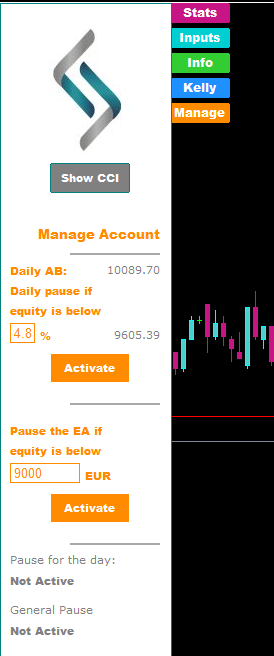
This way, for those who are taking the FTMO Challenge, you can set the daily drawdown to 5% and the general pause to 9000+ in order to deactivate the automated trading before being stopped out by the broker.
Conclusion
You can experiment with the 1/2 Kelly or other risk percentages to find your own unique setup. Playing around with different inputs, instruments, and timeframes can help you discover what works best for you. Remember, the only surefire way to succeed in the markets is to educate yourself and learn from your losses.
I hope you find this tool useful and that it helps you succeed in the markets. Always remember to be disciplined.
Cheers!


