
To know what to buy and what to sell you need to read the chart.
To know what to buy and what to sell you need to read the chart.
Graphs of changes in quotes of currency pairs, stock prices, index values carry much more information than is commonly believed. Few people know that on the chart you can also see the future dynamics.
The issue of modeling the future dynamics of the value of financial assets (currencies, stocks, indices, raw materials, etc.) by plotting graphs showing possible future dynamics is a cornerstone in the field of financial investment.
Investment activity in the financial market is associated with a huge risk of losing capital and requires the investor, in addition to deep knowledge in the field of economics and vast experience in working with finance, also certain analytical skills.
The financial market is very volatile and achieving success in investing requires constant analysis of the continuous flow of data on changes in the value of financial assets and the values of macroeconomic indicators.
The development of investment decisions aimed at capital growth is impossible without a comprehensive analysis, which includes both a fundamental analysis of macroeconomic indicators and a technical analysis of graphically presented data.
To analyze data means to analyze them in dynamics to determine patterns and trends in order to develop scenarios for the development of their future dynamics and plot the values of possible future data on a chart, indicating the cost and time ranges of their future fluctuations.
Modeling the future dynamics of the value in the financial market and the future dynamics of the values of macroeconomic indicators within the framework of the ongoing comprehensive analysis is the main and integral part of the investment process. A modeling method based on chaos theory and fractal geometry is described in the article “When will Dow be Low?” (“Когда Dow станет Low?”) and is shown on the example of a chart of Dow Jones index values with a time frame of 1 year.
Technical analysis is chart analysis.
We can absolutely say that the price chart of any financial asset contains, in addition to information about the dynamics that happened in the past, also information about the dynamics that will happen in the future.
The time series of a financial asset converted into a chart can be compared to written text.
If the text carries meaning in sentences consisting of words, which consist of letters, then the graph carries meaning in fractal structures, which consist of fractals.
A fractal is similar to a letter and, in this case, it can be said that just as words are formed from letters, and sentences are formed from words, so fractals form fractal structures of small orders (phrases), from which, in turn, fractal structures of higher orders are formed (sentences). ).
The letters that have become in a certain sequence form words, a certain sequence of which forms meanings. Therefore, one who knows the alphabet and understands the meaning of words is able to understand and evaluate the information reaching him from outside in a language he understands.
If the information is presented in an unfamiliar language, then its understanding and comprehension requires the study of this unknown mode of communication. Knowledge of a huge number of languages opens up huge opportunities for communication and understanding of what is happening around. However, the mere fact of knowing a large number of modern languages does not mean the ability to immediately read and understand neither ancient manuscripts, nor even cipher texts.
For the uninformed, the graph of the dynamics of the value of currencies, stocks, precious metals, raw materials and other financial assets can be compared with an “encrypted financial manuscript”, which can be read and understood only with the appropriate skills.
The financial market is a non-linear dynamic additive-synergetic system (NDASS) and the pricing mechanism in the financial market is nothing more than a mechanism for the formation of fractal structures on the charts of financial assets, which are non-linear dynamic systems.
Knowledge of the mechanism of formation of fractal structures allows, by extrapolating data on past dynamics, to model the future dynamics of the value of absolutely any financial asset and absolutely any macroeconomic indicator.
It can be said that just as after reading the text its meaning becomes clear, so after decomposing the graph into fractal structures, its future dynamics becomes clear.
A word consists of a combination of letters and conveys meaning, but not any combination of letters will be a word and carry meaning. The same is true with fractals - not every combination of fractals that form a fractal structure will make sense.
Cost is a function of time.
Based on the fact that the financial market is a non-linear dynamic system, the graph of changes in the value of a financial asset over time can be considered as a graph of the function N, which is an operator that sets the correspondence between the set of values P and the set of values T:
P = N(T)
where
P is the price of a financial asset;
T is time.
Taking into account the fact that this is a graph of a non-linear function that describes the dynamics of a non-linear dynamic system, we can say that this graph is an attractor, the structure of which is formed by dynamic fractals.
Definition of a fractal.
By fractal we mean the simplest attractor of oscillatory motion, consisting of three segments, of which one (2nd segment) is directed in the opposite direction to the other two (1st and 3rd segments).
Graphically, the general view of the attractor of the operator N can be represented by a basic fractal.
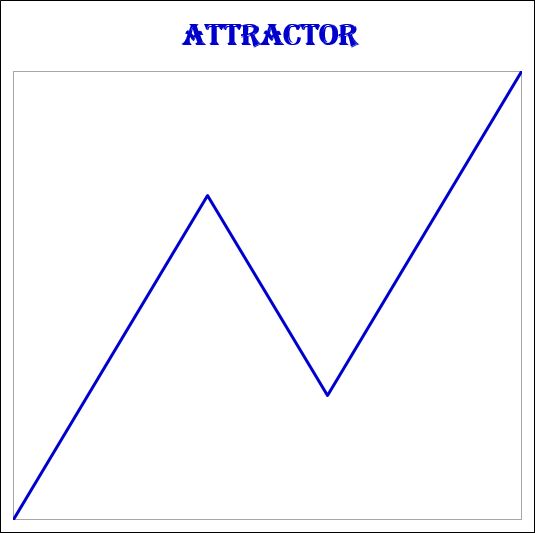
Definition of a basic fractal.
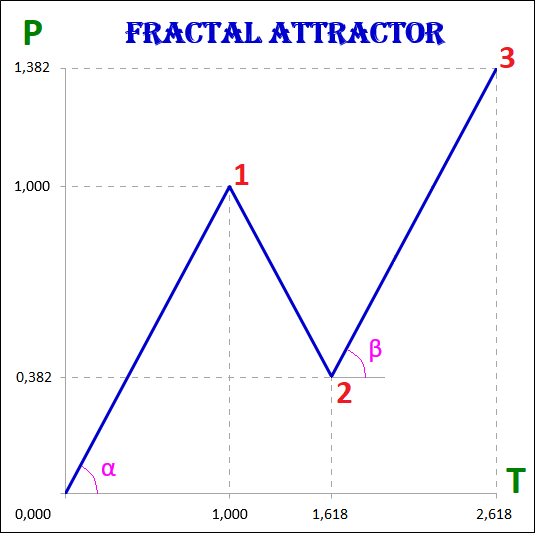
We will call the basic fractal-attractor, in which the values of the cost and time intervals of the 1st and 3rd segments are equal, and the values of the cost and time intervals of the 2nd segment are determined by the golden ratio (golden section) to the values of the cost and time intervals of the 1st segment:
1. The 3rd segment is equal to the 1st segment both in terms of time and price (α=β):
P1 = P3, T1 = T3;
2. The 2nd segment correlates with the 1st segment both in terms of price and time with a Fibonacci coefficient equal to 0.618:
P2 / P1 = 0.618, T2 / T1 = 0.618.
Fractals are divided into views and types depending on the size of the cost and time intervals of their segments.
According to the self-similarity property, fractals of a lower order form fractals of a higher order, respectively, fractals of a higher order consist of fractals of a lower order.
Any fractal, in addition to the cost and time values of the intervals, has the following characteristics that describe it:
1. The order of a fractal, which indicates which segment it is in relation to fractals of a higher order and which segments of fractals of a lower order it is formed by itself.
2. Type of fractal.
3. View of fractal.
The fractal structureis the interconnection of fractals of various orders, views, types among themselves.
For example, the fractal structure of the basic attractor, consisting of fractals of the 5th order, will look like this.
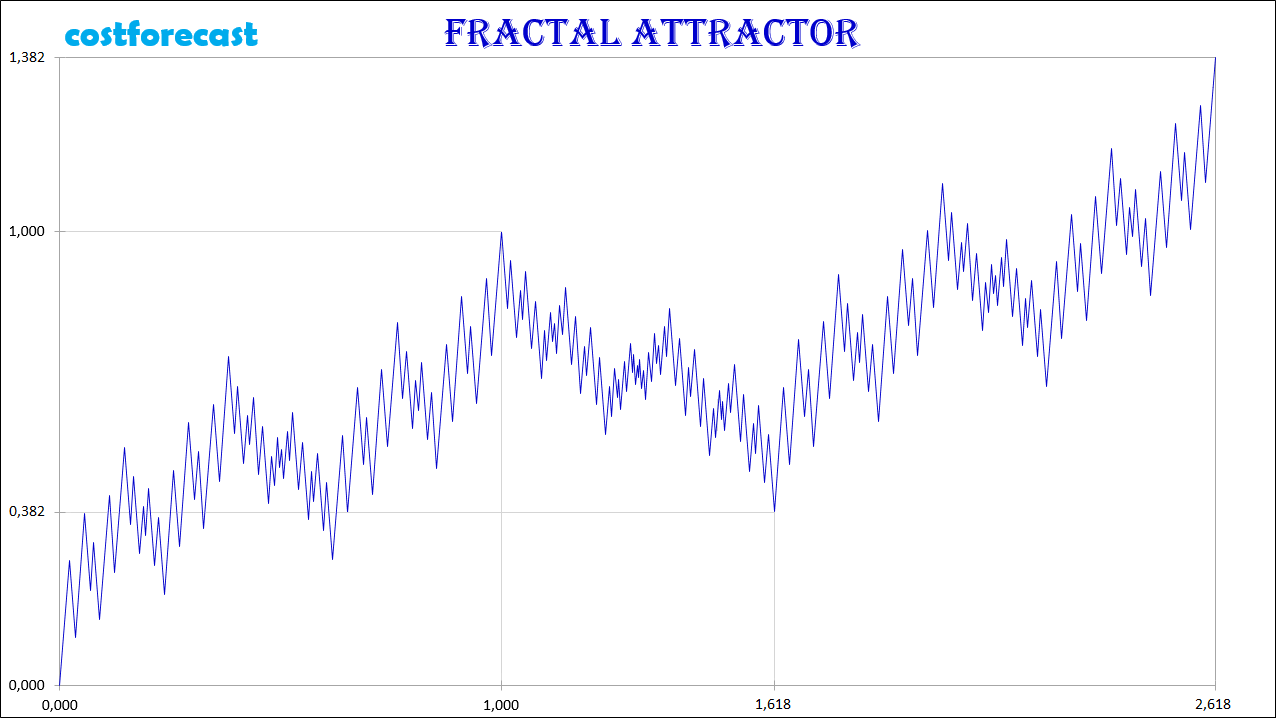
The real market dynamics of the value of any financial asset is described by the operator N.
The basic fractal is one of the many fractals that form the fractal structure of the price dynamics graphs, which are attractors.
To describe the fractal structure of an attractor means to describe the types and types of fractals of its components, their sequence and location in relation to each other.
The fractal structure of the attractor is both so complex and so simple that it is impossible to say what is more on the chart of quotations of financial assets - chaos or order.
The order is understood as a completed fractal, that is, a fractal in which all three of its segments are formed - the 1st, 2nd and 3rd. The completion of the 3rd segment indicates the completion of the entire fractal, since this is preceded by the successive completion of the 1st and 2nd segments.
Chaos in this case is the process of fractal formation.
We can say that order is discrete and chaos is continuous. The end of the 3rd segment of one fractal is replaced by the beginning of the 1st segment of another fractal of the same order or higher.
Taking into account the fact that fractals of a smaller order form fractals of a higher order, we can say that chaos and order are inseparable.
There is order in chaos and there is chaos in order. Chaos and order permeate each other and exist one in the other.
The dynamics of value in the financial market can be characterized as both chaotic and ordered. But chaos itself is nothing but the order of the highest level, because nothing chaotic happens, since the graph of this dynamics is an attractor of a dynamic fractal defined by the operator N.
Fractal order.
Each fractal in a fractal structure is the first, second, or third segment of another fractal that has a higher order.
An accurate description of the location of fractals in a fractal structure requires their designation, the assignment of certain numbers to fractals, which makes it possible to unambiguously understand which segments the fractals are and what their order is in relation to other fractals.
A fractal whose number consists of one digit is a fractal of the 1st order, which is the highest.
A fractal whose number consists of two digits is a fractal of the 2nd order, of three - of the 3rd order, of four - of the 4th, etc.
Fractals of the 4th order make fractals of the 3rd order, which in turn make up the fractals of the 2nd order, and those already make up the fractals of the highest 1st order.
Numbering of fractals.
The fractal of the highest 1st order has the number 1, 2 or 3 in accordance with which segment it is - the first, second or third. A 1st order fractal consists of segments that are 2nd order fractals.
The fractal with number 1 consists of segments with numbers: 11 (1st segment), 12 (2nd segment) and 13 (3rd segment).
The fractal with number 2 consists of segments with numbers: 21 (1st segment), 22 (2nd segment) and 23 (3rd segment).
The fractal with number 3 consists of segments with numbers: 31 (1st segment), 32 (2nd segment) and 33 (3rd segment).
Fractals have the same order if they are either segments of one fractal that makes it up, or are segments of other fractals, which in turn are segments of another fractal.
A fractal has one order of magnitude less than another fractal if it is its segment.
A fractal has one order of magnitude more than another fractal if that other fractal is its segment.
A fractal marked with a number is like a point marked with coordinates, which is easy to find in the corresponding coordinate system. In our case, the coordinate system is a fractal structure.
So, for example, if the fractal coordinates are number 123, then this means that this fractal is the 3rd segment of the 2nd order fractal with number 12, which in turn is the 2nd segment of the 1st order fractal with number 1.
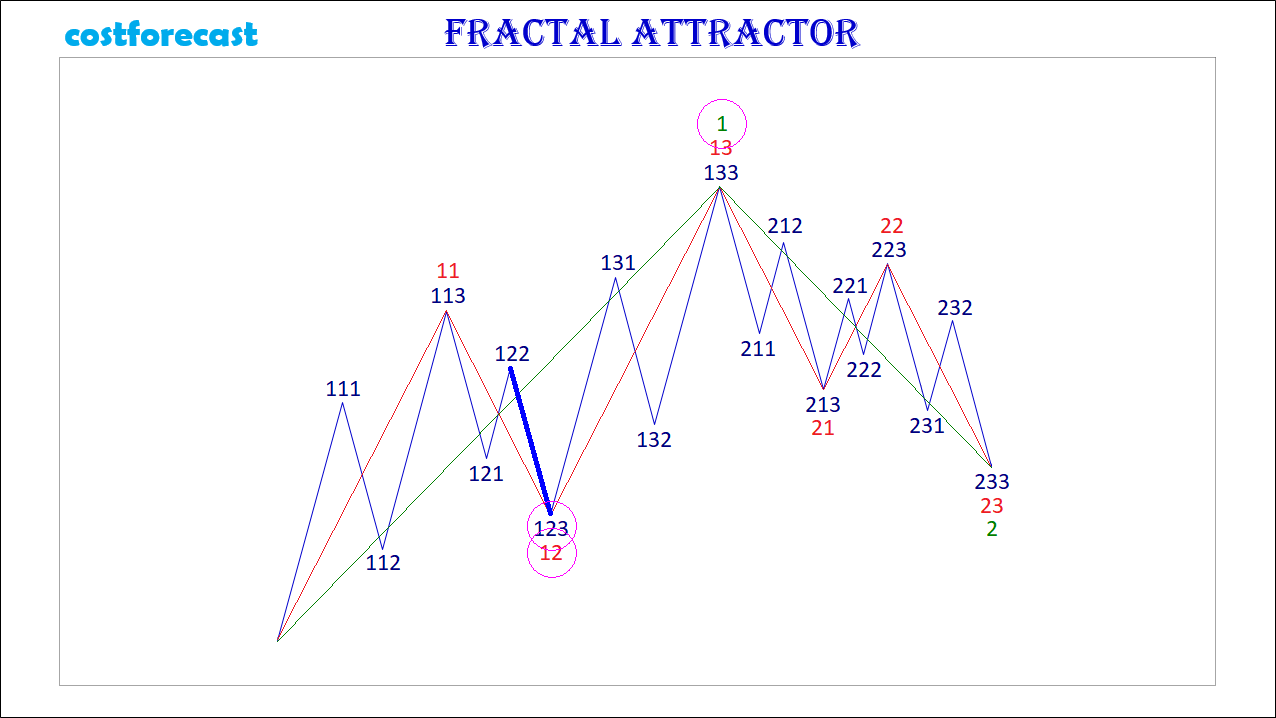
Extremum points.
The dynamics of the value in the financial market is an alternation of uptrends and downtrends with the formation of points of local and global extremums on the charts.
From the point of view of the fractal structure of charts, extreme points (points where trends change) are points at which some fractal segments complete their formation and others begin to form.
The local extremum points on the chart are the points where the first segments of fractals end and the second segments begin, and the second fractal segments end and the third segments begin.
The global extremum points on the chart are the points where the third fractal segments end and the first segments begin.
Views and types of fractals.
The fractal has three segments - the first, second and third. The second segment of the fractal is always directed in the opposite direction to the first and third segments.
In addition to the order, which also indicates the segment number, each segment of the fractal has two characteristics (two parameters) - this is the price P (cost interval) and time T (time interval).
P is a value characteristic that shows the length of the projection of the fractal segment on the price axis, thereby indicating the price interval in which the segment was formed.
T is a time characteristic showing the length of the projection of the fractal segment on the time axis, thereby indicating the time interval that was required to form the segment.
A fractal consisting of three segments has six characteristics - these are P1, P2, P3, T1, T2, T3:
• Р1 and Т1 – price and time intervals of the 1st segment;
• Р2 and Т2 – price and time intervals of the 2nd segment;
• Р3 and Т3 – price and time intervals of the 3rd segment.
The main fractal is the basic fractal, the cost and time parameters of the segments of which correlate with each other in the following proportions:
1st proportion: P1 P3 = T1/T3 = 1;
2nd proportion: P2/P1 = T2/T1 = 0.618.
By changing the values of the parameters of the basic fractal using the golden section, using the Fibonacci coefficients, we get a certain set of fractals, which can be classified by views and types.
From the ratio of the cost parameters of the 1st and 3rd segments, three views of fractals can be distinguished.
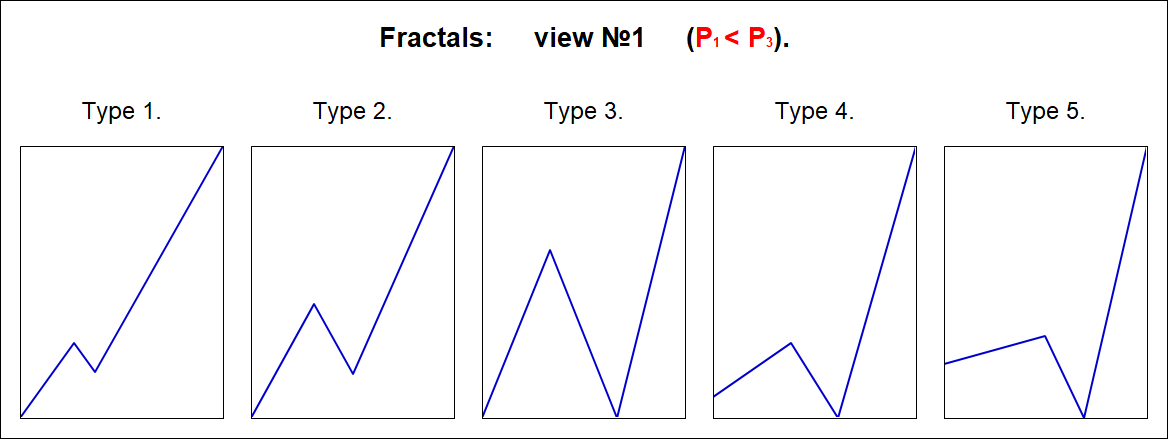
View No. 1 - these are fractals, in which the price interval of the third segment is greater than the price interval of the first segment: Р1 < Р3;
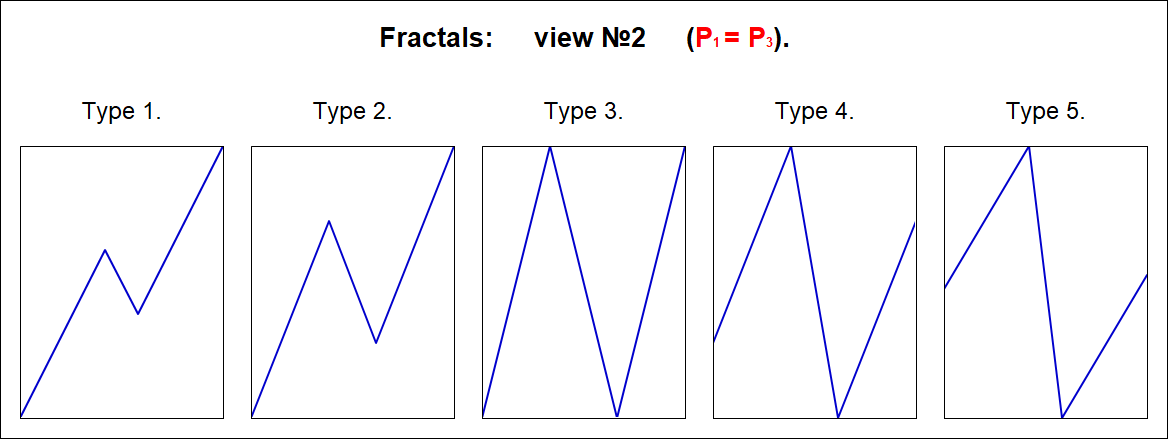
View No. 2 - these are fractals, in which the price interval of the third segment is equal to the price interval of the first segment: Р1 = Р3;
View No. 3 are fractals in which the price interval of the third segment is less than the price interval of the first segment: Р1 > Р3.
Regarding each type of fractals, we can say that the 2nd view of fractals characterizes normal dynamics, the 1st view of fractals characterizes dynamics with acceleration, and the 3rd view of fractals characterizes dynamics with deceleration.
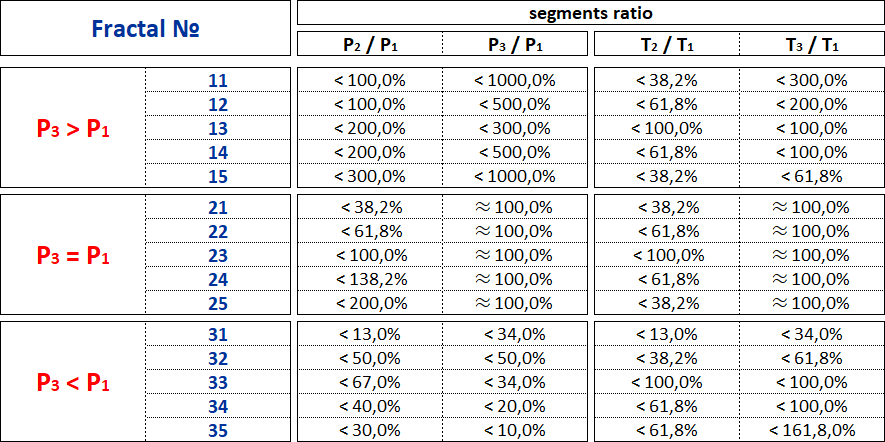
From the ratios of the cost and time parameters of the 1st, 2nd and 3rd segments, five types of fractals in each view can be distinguished among themselves.
Three views and five types give 15 fractals, including the basic one.
Fractals of the 1st view are designated by numbers: 11, 12, 13, 14, 15.
Fractals of the 2nd view are designated by numbers: 21, 22, 23, 24, 25.
Fractals of the 3rd view are designated by numbers: 31, 32, 33, 34, 35.
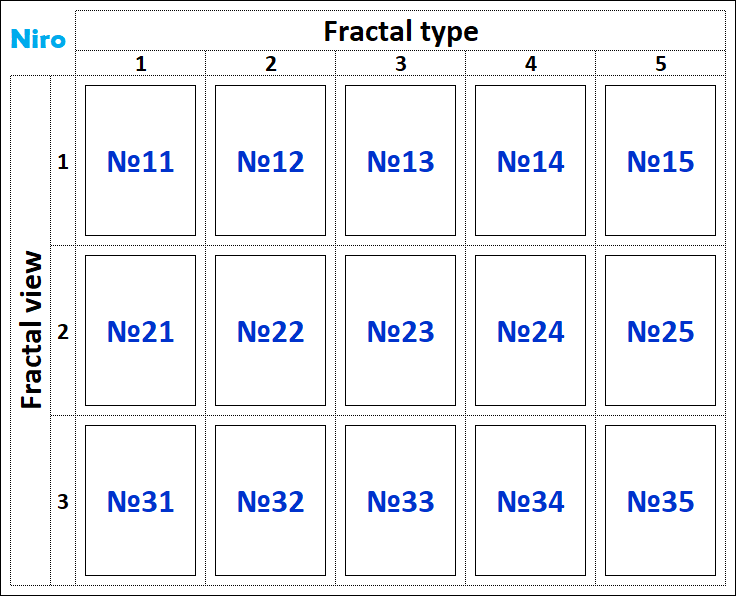
The first digit in the number indicates the view of fractal - 1st, 2nd or 3rd, and the second digit in the number indicates the type of fractal - 1st, 2nd, 3rd, 4th or 5th.
Fractals of the 1st view have the following five types:
Fractals of the 2nd view have the following five types:
Fractals of the 3rd view have the following five types:

The Alphabet of Niro Attractors.
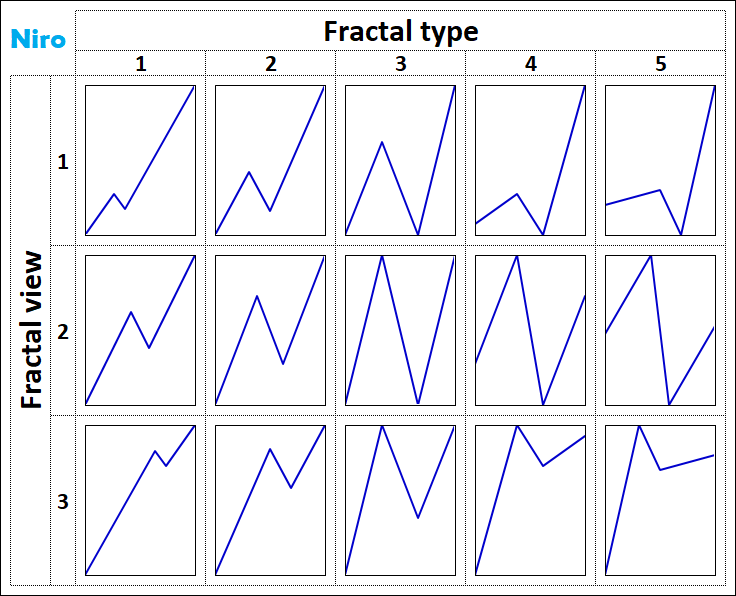
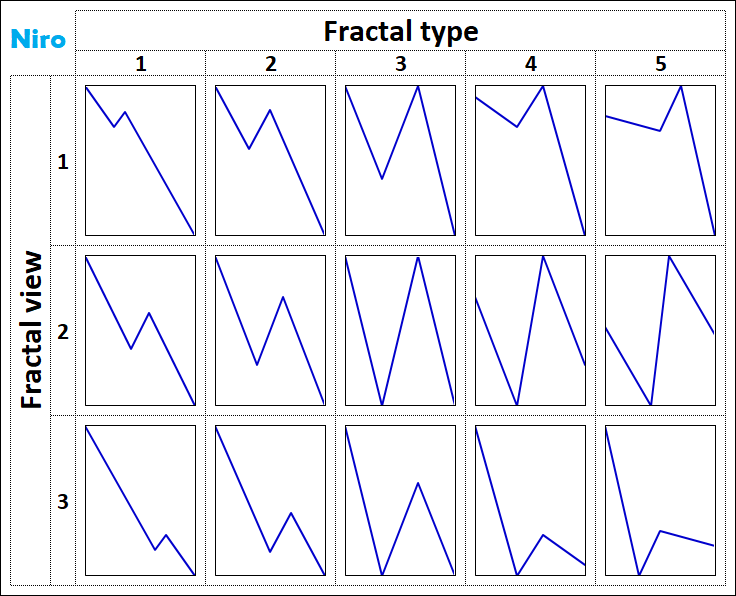
From 15 fractals, you can make a kind of alphabet of 15 letters.
For example, as in Morse code, combinations of two symbols - dots and dashes, you can write any text, and in the alphabet of attractors Niro, combinations of 15 fractals can describe any fractal structure FS of any underlying asset BA.
On picture 8 shows the Alphabet of Niro attractors with positive fractals, that is, upwards.
On picture 9 shows the Alphabet of Niro attractors with negative fractals, that is, having a downward direction.
On picture 10 shows the fractal numbers in Niro's Alphabet of Attractors.
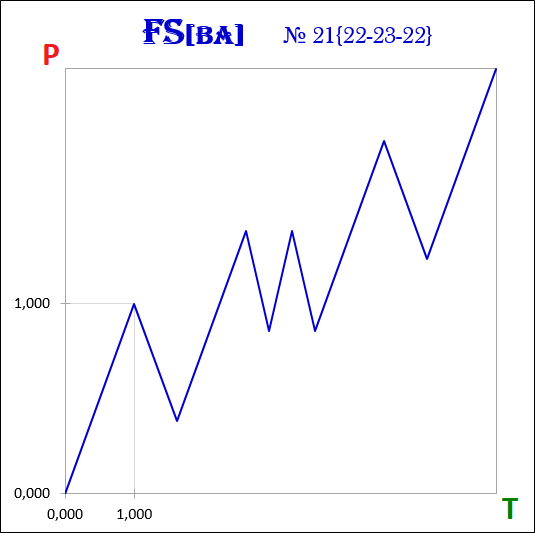
For example, the fractal structure FS of the chart of the underlying asset BA with the designation:
FS[BA] → 21 ≡ {22,23,22}
says that it is a fractal-attractor No. 21 (2nd view of 1st type), which has:
• the first segment is a fractal No. 22 (of the 2nd view of the 2nd type),
• the second segment is fractal No. 23 (2nd view of 3rd type) and
• the third segment is fractal No. 22 (2nd view of 2nd type).
Modeling method.
The essence of the cost dynamics modeling method is to identify the fractal structure of the chart of a financial asset and its description using attractors from the Niro alphabet.
The process of formation of the fractal structure of the attractor by dynamic fractals is cyclical, and therefore predictable, i.e. it is possible to simulate the future dynamics of quotations of any financial instruments.
In the graphs of the dynamics of value in the financial market, there is a cycle, which consists in the formation of a fractal and is expressed in:
1) Formation of the 1st segment of the fractal;
2) Formation of the 2nd segment of the fractal, directed in the opposite direction to the 1st;
3) Formation of the 3rd segment of the fractal, which has the same direction as the 1st.
After the completion of this cycle, exactly the same cycle begins, but in the opposite direction. All these actions continue indefinitely - the first segment is always followed by the second segment, the second segment is always followed by the third segment, and the third segment is always followed by the first segment.
The cyclical nature of the process of formation of fractals and fractal structure in accordance with a certain order gives an understanding of which segment of the fractal and in which direction will be formed after the formation of the current segment is completed.
At any moment in time, the dynamics of the value of any financial asset is in the formation of one of the three segments of the fractal - the first, second or third. After the first segment of the fractal, the second segment of the same fractal is always formed, after which the third segment of the same fractal is always formed, and then the first segment begins to form again, but of another fractal, which has either the same order or a larger one, and which is necessarily directed in the opposite direction the previous fractal.
Extremum points on the chart are the points at which either the first segments end and the second ones begin, or the second segments end and the third ones begin, or the third segments end and the first ones begin. Extreme points determine the boundaries of the cost and time intervals of fractals in the fractal structures of attractors.
The proportions between the values of the cost and time intervals of the segments make it possible to determine:
• which segments they are - first, second or third,
• what kinds and types of fractals these segments form, and
• what is the order of the formed fractals in the fractal structure in relation to each other.
The method of modeling the dynamics of quotations of financial instruments is based on determining what the current segment of the fractal is - the first, second or third, in order to determine which segment of the fractal will be the next after the current one.
The Alphabet of Attractors Niro contains 15 fractals-attractors, to which the graph of the dynamics of the value of any financial asset will tend.
Modeling the future dynamics of value begins with the analysis of the main fractal structure, consisting of fractals of the highest order, that is, with the analysis of charts built on annual time frames. As part of the analysis of the main fractal structure, it is determined to which of the 15 types of attractors the graph of the dynamics of the value of a financial asset belongs.
Having identified the attractor of the main fractal structure, it is possible to make not only long-term forecasts of the value dynamics, but also medium-term and short-term forecasts, because the formation of fractal structures, consisting of fractals with an order lower than the highest, will occur in strict accordance and submission to the main fractal structure.
Thus, in order to understand the chart and clearly see the future dynamics of the financial market, it is necessary to know the Alphabet of Niro attractors and be able to use it to read and describe the fractal structures of the charts of financial instruments traded on the currency, stock, commodity markets.
The Alphabet of Niro eliminates any uncertainty from the dynamics of the financial market and makes the pattern in the dynamics of the value of financial assets clear and obvious.
Let's take a look at how to use the Niro Alphabet of Attractors to read the Dow Jones Index chart and understand the future dynamics of the US stock market.
It is necessary to start the analysis of the global fractal structure by plotting the Dow Jones index with an annual time frame.
As of early July 2021, the index chart looks like this:
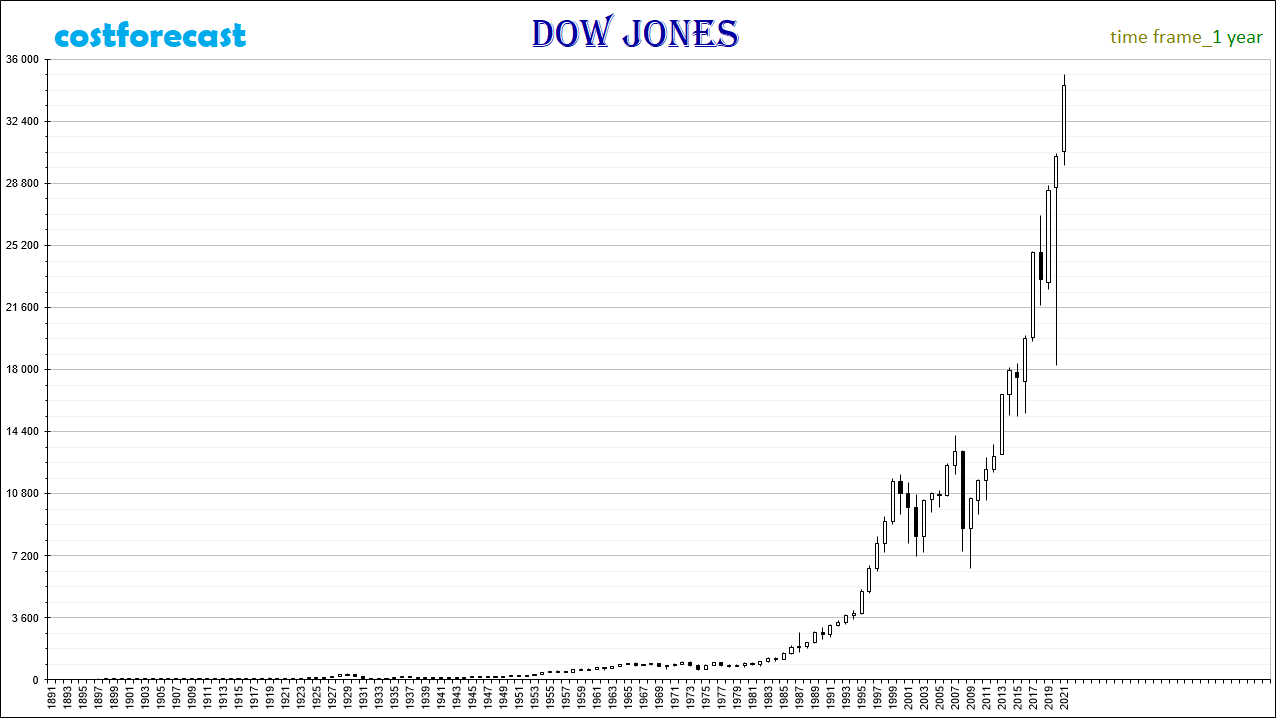
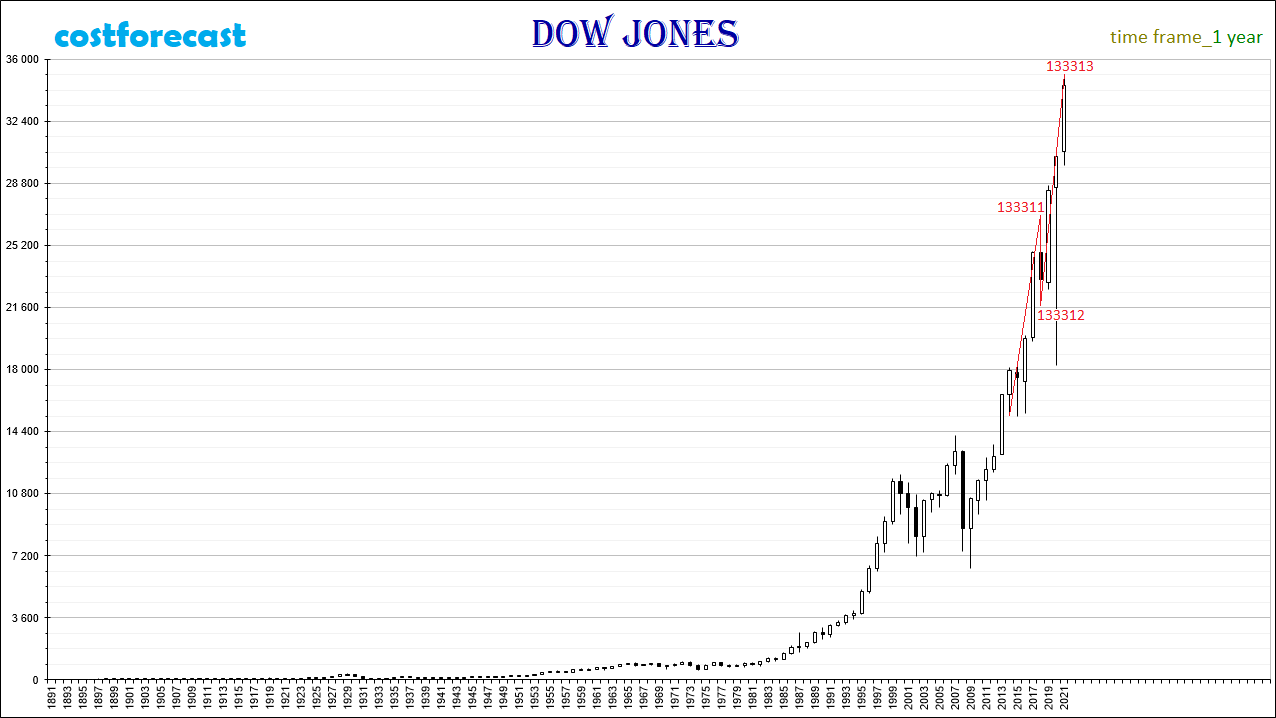
On the time interval from 2014 to 2021, a 5th order fractal F13331 was formed in the fractal structure of the Dow Jones index chart (Pic. 14), which means that the future dynamics of the index values will be downward as part of the formation of a fractal directed towards it in the opposite direction.
Taking into account the emerging local fractal structure, it can be assumed that within the time interval (1978, 2035), the following four fractals will complete their formation simultaneously in 2035: F1333, F133, F13, F1.
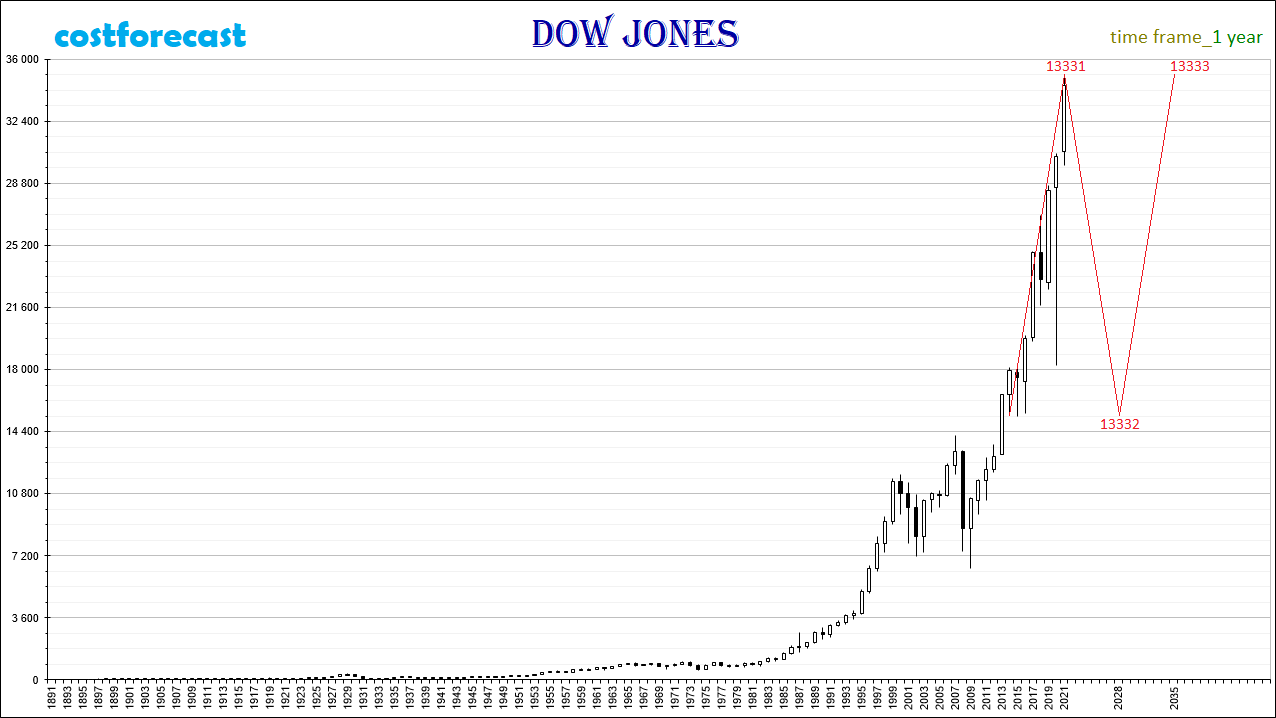
1. F1333 fractal (Pic. 15) is a 4th order fractal, consists of segments: F13331, F13332, F13333, which are 5th order fractals and can be Fractal No. 23 from the Niro alphabet:
F1333 ≡ F23.
Predicted time interval T1333 - (2014, 2035).
Predicted cost interval P1333 = 19750.86.
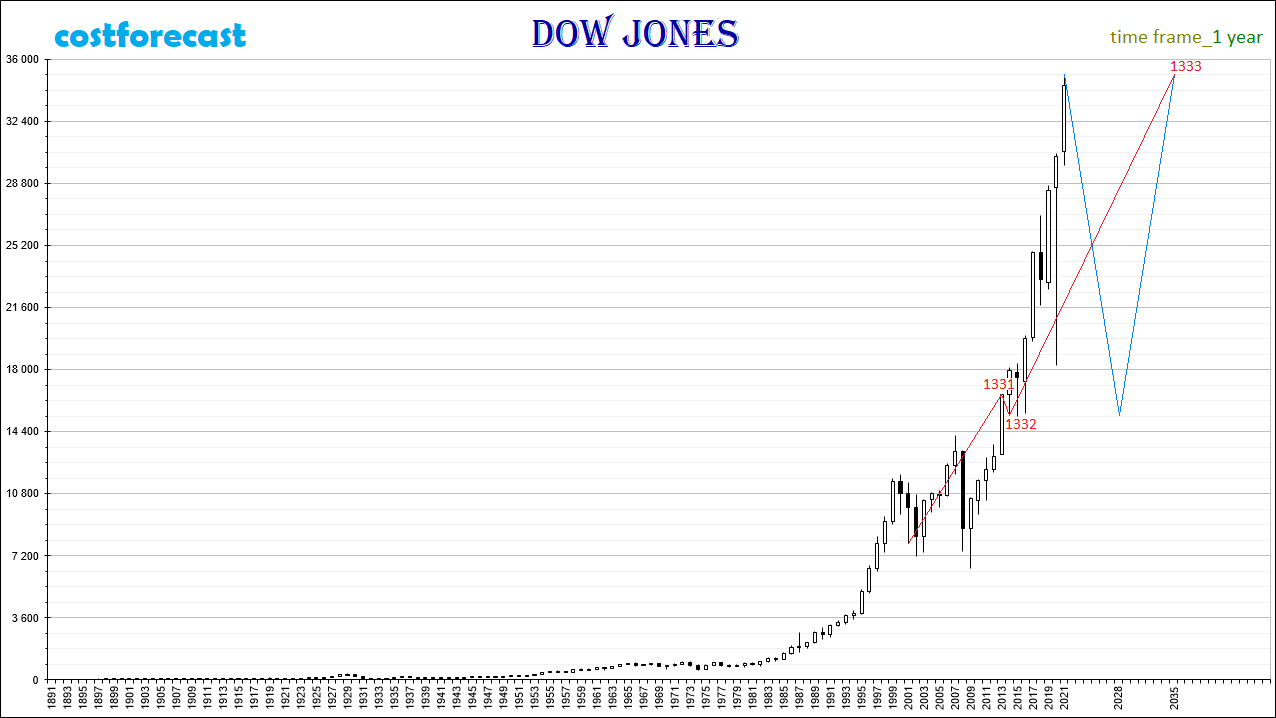
2. Fractal F133 (Pic. 16) is a 3rd order fractal, consists of segments: F1331, F1332, F1333, which are 4th order fractals and can be Fractal No. 11 from the Niro alphabet:
F133 ≡ F11 → FS {13, MS, 23}.
Predicted time interval T133 - (2001, 2035).
Predicted cost interval P133 = 27164.66.
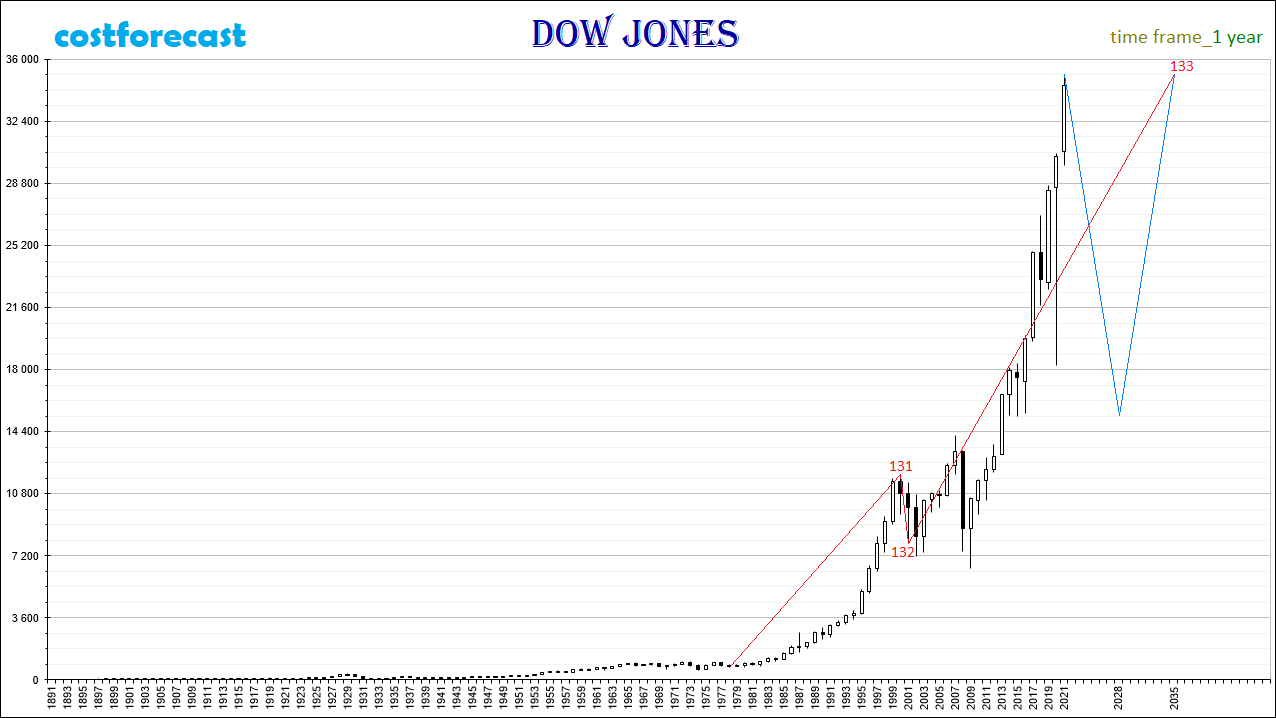
3. Fractal F13 (Pic. 17) is a 2nd order fractal, consists of segments: F131, F132, F133, which are 3rd order fractals and can be Fractal No. 11 from the Niro alphabet:
F13 ≡ F11 → FS {11, MS, 11}.
Predicted time interval T13 - (1978, 2035).
Predicted cost interval P13 = 34354.76.
4. The fractal F1 (Pic. 18) is a fractal of the highest 1st order, consists of segments: F11, F12, F13, which are fractals of the 2nd order and can be Fractal No. 11 from the Niro alphabet:
F1 ≡ F11 → FS {13, 23, 11}.
Predicted time interval T1 - (1896, 2035).
Predicted cost interval P1 = 35062.90.
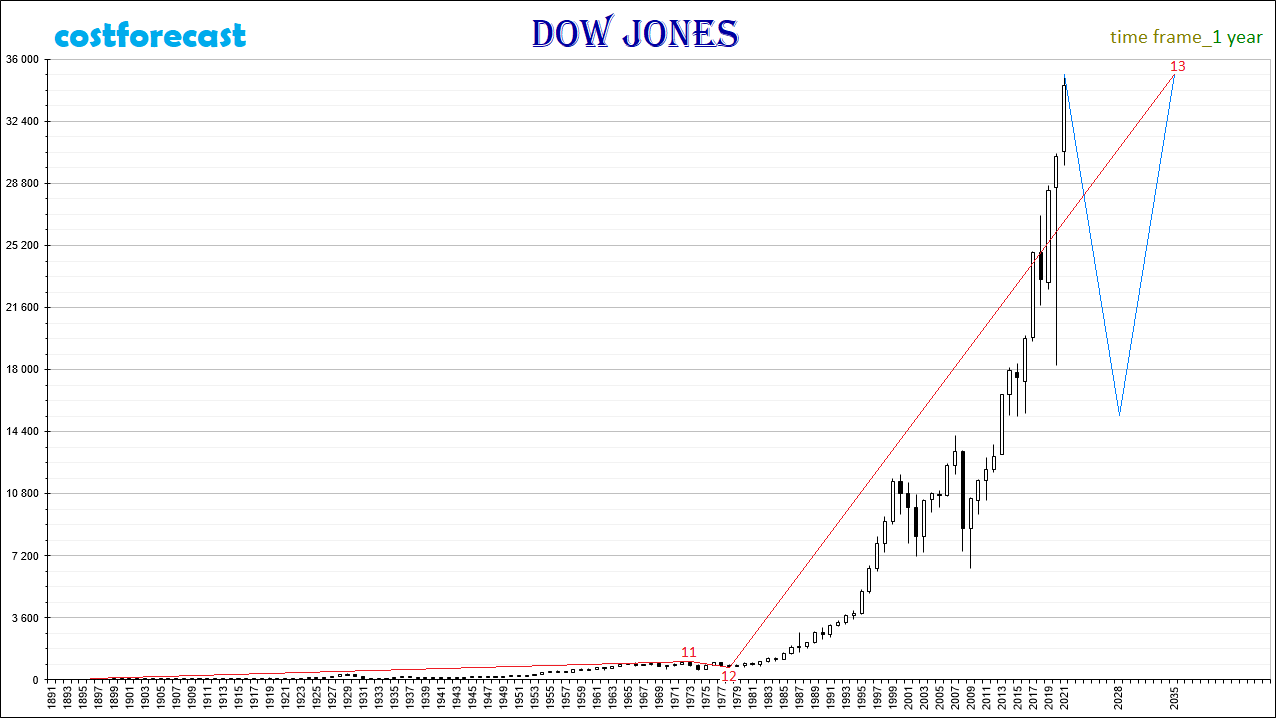
The 5th order fractal F13331 began to form in October 2014 and completed in May 2021. F13331 is the 1st segment of the 4th order fractal F1333, after which the fractal F13332, which is the 2nd segment of the F1333 fractal, will begin to form, and then the fractal F13333, which is the 3rd segment of the F1333 fractal.
The 2nd segment F13332 of the F1333 fractal, having started to form in May 2021, may complete its formation in 2028. As part of the formation of the F13332 fractal, the values of the Dow Jones index may drop to 16,000 points by 2028.
The 3rd segment F13333 of the F1333 fractal may form in the time interval from 2028 to 2035. As part of the formation of the F13333 fractal, the Dow Jones index may again rise from 16,000 points to 36,000 points.
F13333, F1333, F133, F13 fractals are the third segments of fractals, in which the order of each subsequent fractal is higher than the previous one by one.
With the completion of the 5th order fractal F13333, the 4th order fractal F1333 and the 3rd order fractal F133 and the 2nd order fractal F13 and the highest 1st order fractal F1 will be completed simultaneously.
Fractal of the 2nd order F11 is the 1st segment of the fractal of the highest 1st order F1. F11 was formed in the time interval from 1896 to 1973.
The 2nd order fractal F12 is the 2nd segment of the highest 1st order fractal F1. F12 was formed in the time interval from 1973 to 1978.
The 2nd order fractal F13 is the 3rd segment of the highest 1st order fractal F1. F13 will form in the time interval from 1976 to 2035.
Thus, the attractor of the fractal structure FS {13, 23, 11} of the Dow Jones index chart is the F11 fractal - fractal No. 11 from the Niro alphabet, which is of the 1st type and belongs to the 1st type.
The completion of the F13 fractal in 2035 will complete the F1 fractal. Thus, the cycle of growth in the Dow Jones index that began in 1896 will come to an end.
In 2035, the US stock market will begin a global downtrend. The fall in US stock prices may be so strong that the value of the Dow Jones index will drop to the level of 2700 points (Pic. 19). This decrease will take place within the framework of the formation of a fractal of the highest order F2, which is the second segment in the global fractal structure.
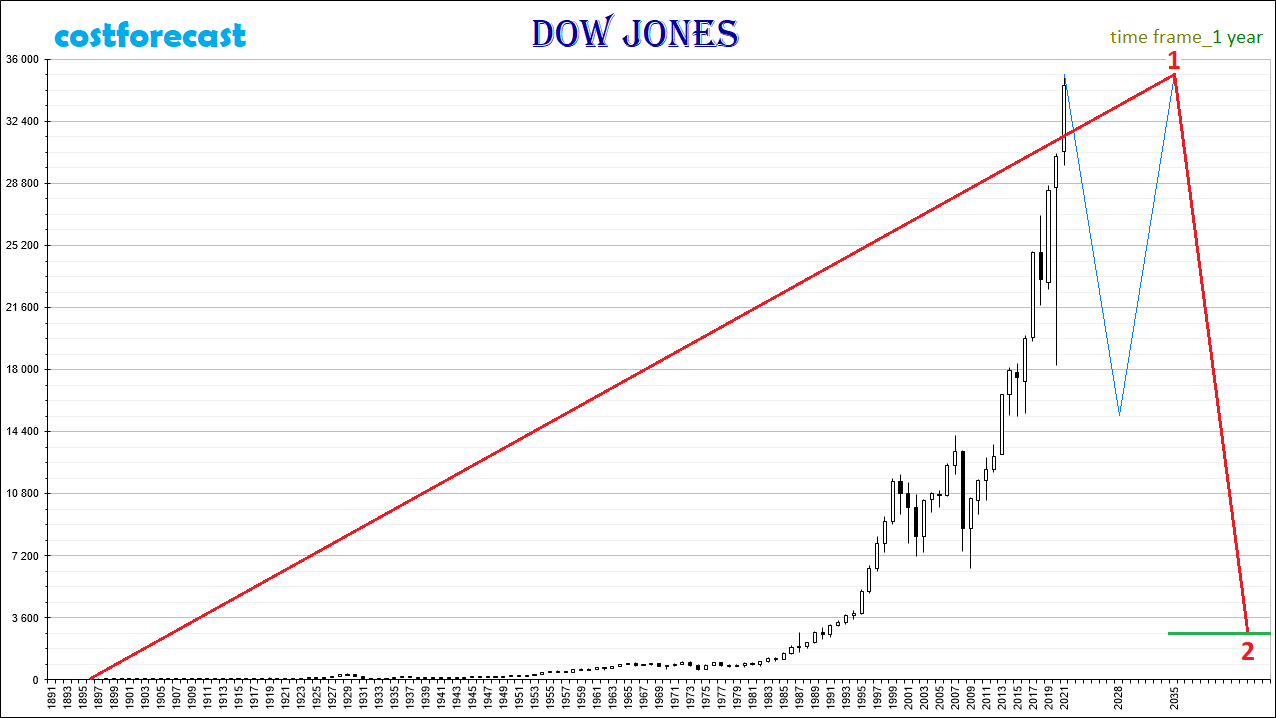
Omitting complexity and speaking more simply, the fractal structure of the Dow Jones index is in the process of forming a fractal, which is indicated on the chart in red (Pic. 20).
The 1st segment of the red fractal is a fractal one order of magnitude lower, which is marked in blue on the chart.
The 3rd segment of the red fractal is the fractal, one order of magnitude lower, which is marked in green on the chart.
The upcoming dynamics of the index will initially be downward as part of the formation of the 2nd segment of the fractal, which is indicated in green, and then upward as part of the formation of the 3rd segment of this green fractal.
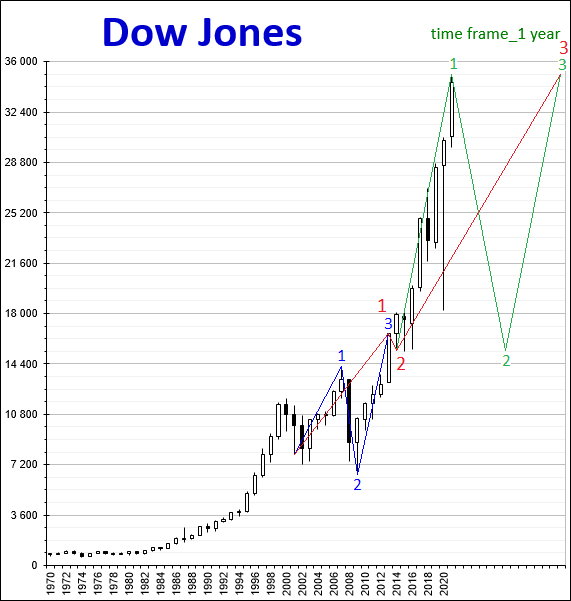
If we consider the dynamics of the Dow Jones index on charts with smaller fractal structures, then the dynamics displayed on them will occur in strict accordance and submission to the global fractal structure.
On picture 21 shows a chart of the Dow Jones index, built with a time frame of 1 month. The markup of the fractal structure of the chart corresponds to the applied fractal markup on the chart with a time frame of 1 year in picture 20.
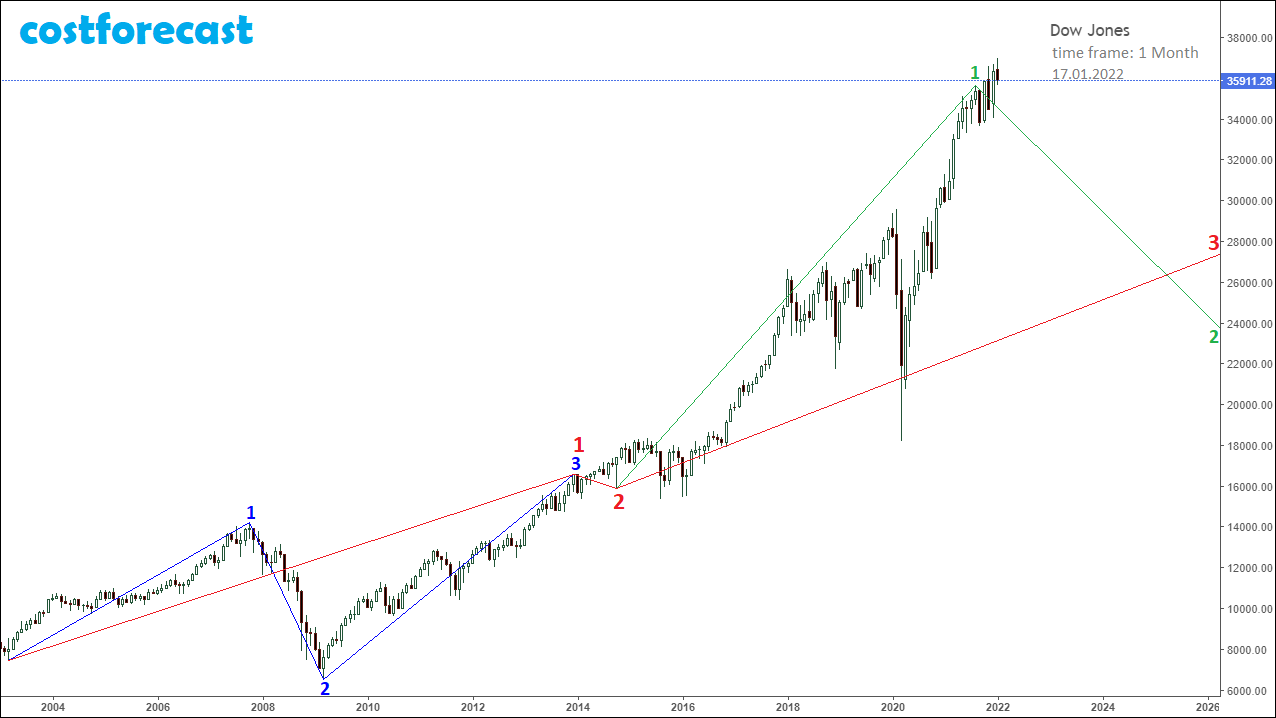
On picture 22 shows a graph of the Dow Jones index, built with a time frame of 1 month, with a fractal markup applied, showing the upcoming downward dynamics of the index in the direction of the 2nd segment of the fractal, which is marked in green on the chart.
The 1st segment of the green fractal is indicated on the chart in olive color, the 1st segment of which is indicated by an orange fractal, and the 3rd segment by a dark brown fractal.
On picture 22, the light brown fractal is the 1st segment of the orange fractal, and the blue fractal is the 1st segment of the dark brown fractal.
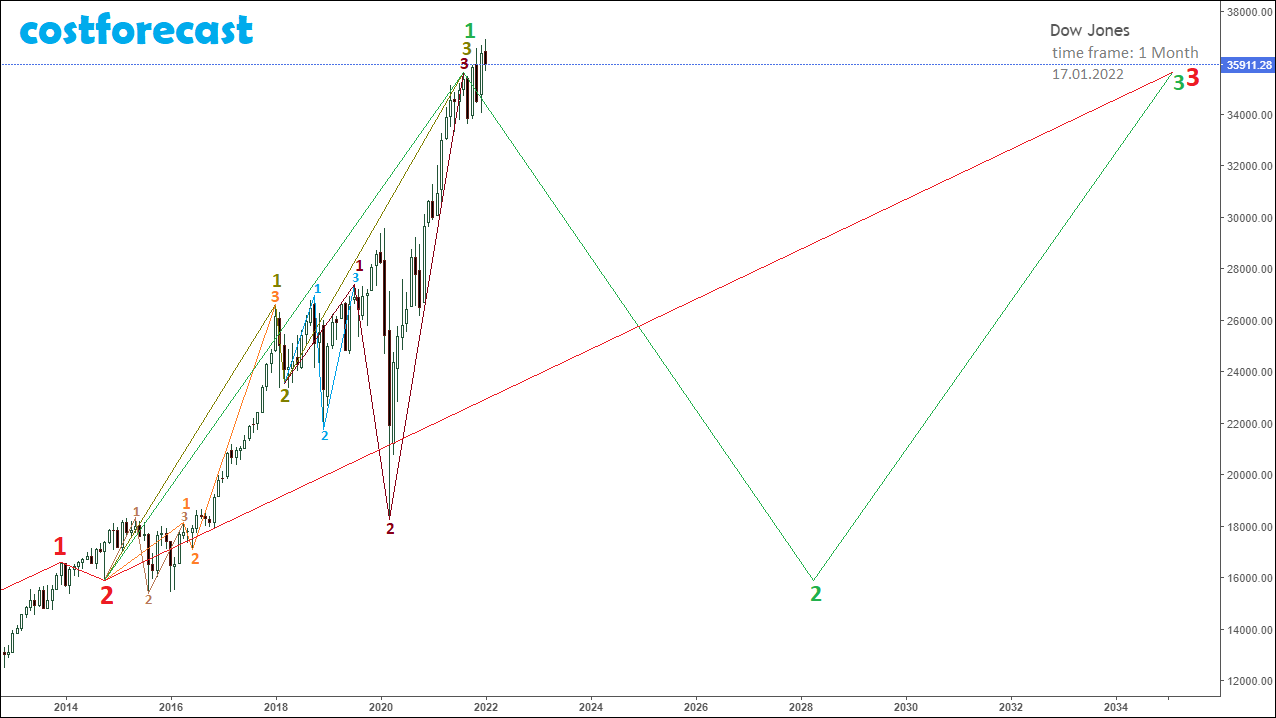
On picture 23 shows the beginning of a downtrend on a chart of the Dow Jones index, which is built with a time frame of 1 week.
The chart shows the 3rd segment of the olive fractal, which is a fractal one order of magnitude lower, which is indicated on the chart in dark brown.
The 1st segment of the dark brown fractal is indicated on the chart by a blue fractal.
The 2nd segment of the dark brown fractal is indicated on the chart by a pale red fractal.
The 3rd segment of the dark brown fractal is indicated on the chart by a pink fractal.
Taking into account such a fractal structure of the chart, the upcoming dynamics of the Dow Jones index will proceed within the framework of the formation of a fractal in the opposite direction to the fractal indicated in pink.
The decrease in the values of the Dow Jones index will occur as part of the formation of a fractal, which is indicated in red on the chart.
As of 01/17/2022, both the 1st and 2nd segments of the red fractal have already been formed.
The most likely scenario for the completion of the 3rd segment of the red fractal will be a decrease in the Dow Jones index in the range of 26,000-30,000 points.
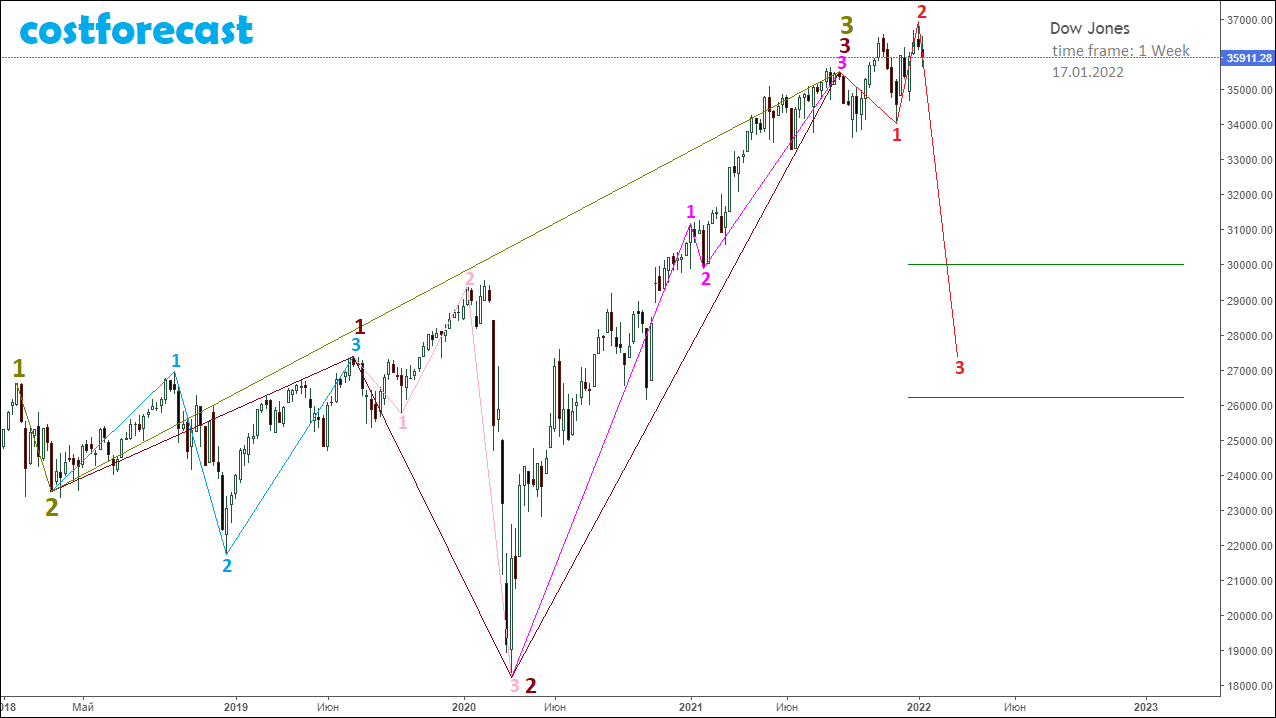
On picture 24 shows the structure of the pink fractal, which is the 3rd segment of the higher order fractal, indicated in dark brown.
The 1st segment of the pink fractal is indicated on the chart by a dark gray fractal.
The 3rd segment of the pink fractal is indicated on the chart by a light purple fractal.
In the opposite direction to the pink fractal, a red fractal is formed, the 1st segment of which is indicated on the chart by an orange fractal.
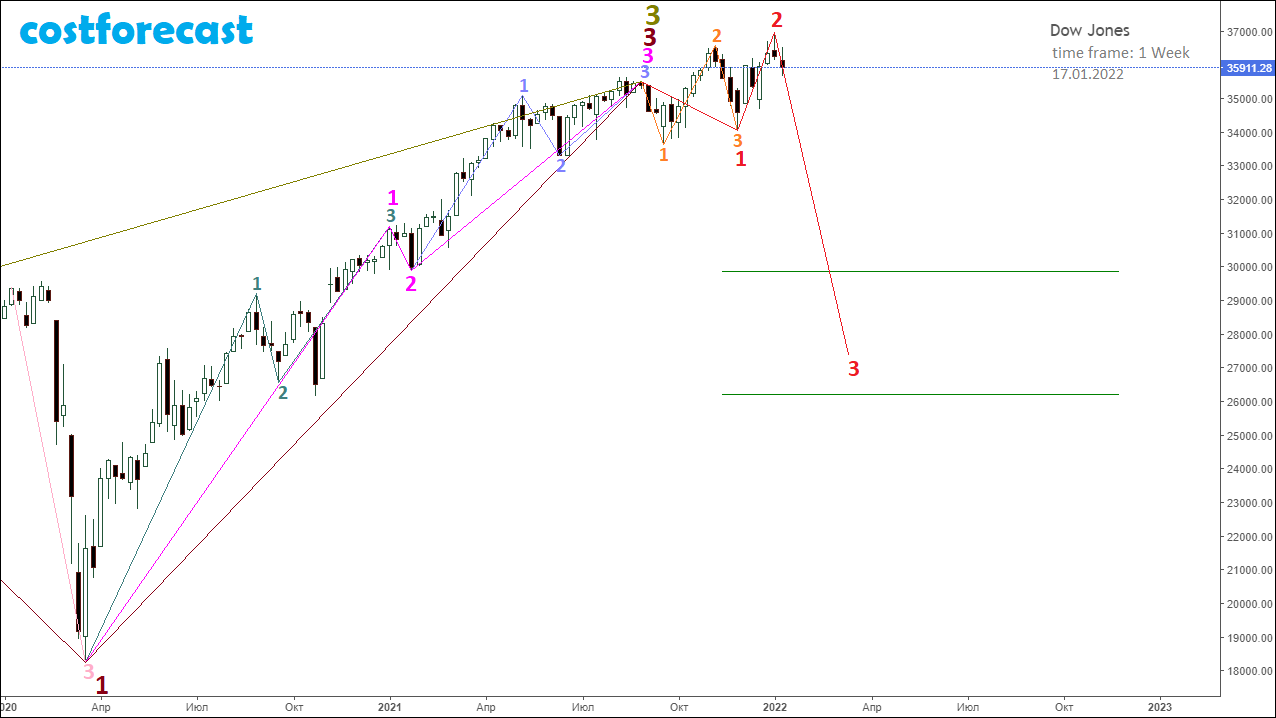
On picture 25 shows the fractal structure of the Dow Jones index chart, built with a time frame of 1 day.
This graph shows the fractal structure of the already completed 1st and 2nd segments of the red fractal on an enlarged scale.
The 1st segment of the red fractal is indicated on the chart by the orange fractal.
The 2nd segment of the red fractal is indicated on the chart by the green fractal.
The 3rd segment of the red fractal has just begun to form its fractal structure, which already includes the fractal that is being formed on the chart, indicated in pink.
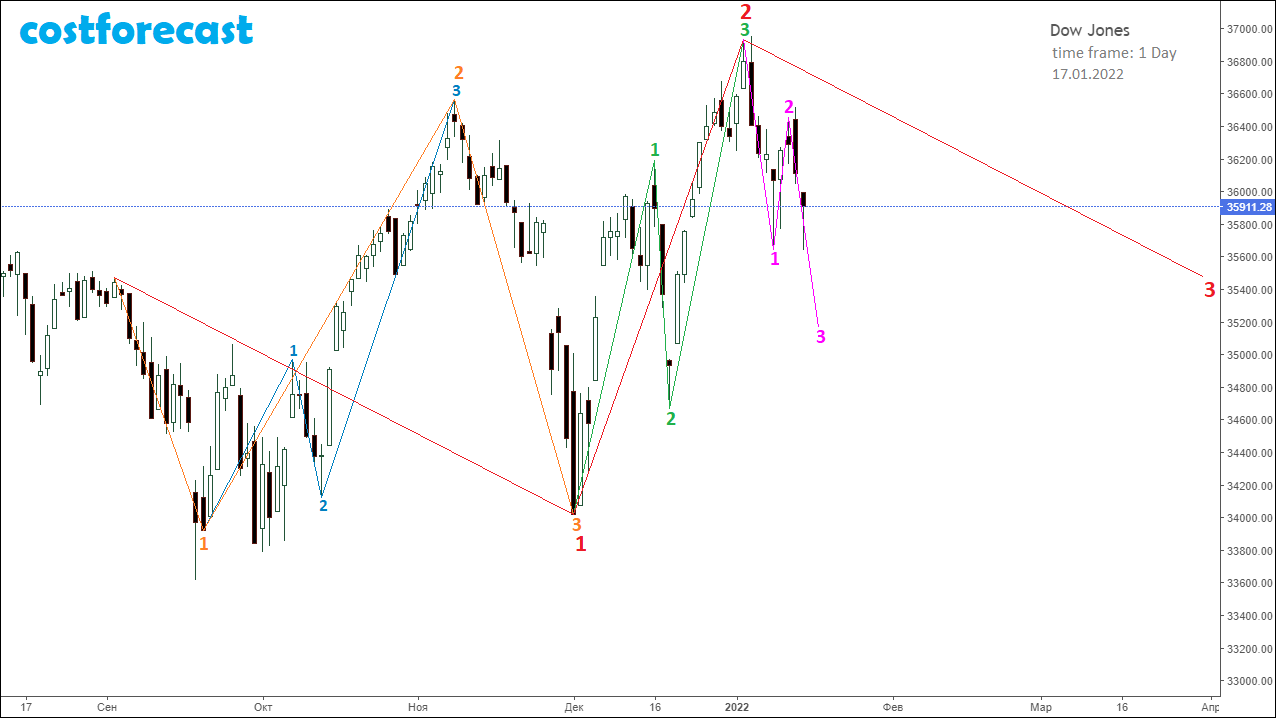
On picture 26 shows the fine fractal structure of the Dow Jones index chart, built with a time frame of 1 hour.
This graph shows fractals of small orders that make up the 2nd segment of the red fractal, indicated on the graph by a green fractal.
The 1st segment of the green fractal is indicated by a light purple fractal, which has a pale red fractal as its 3rd segment.
The 2nd segment of the green fractal is indicated by a fractal, the segments of which are numbered in gray.
The 3rd segment of the green fractal is indicated by a dark purple fractal, which has a pale pink fractal as its 3rd segment.
The dynamics of the values of the Dow Jones index as of 01/17/2022 proceeds as part of the formation of a fractal, which is indicated in pink on the chart.
The 1st segment of the pink fractal is indicated by a fractal, the segments of which are numbered in dark brown.
The 2nd segment of the pink fractal is indicated by a fractal, the segments of which are numbered in light brown.
The 3rd segment of the pink fractal is still being formed.
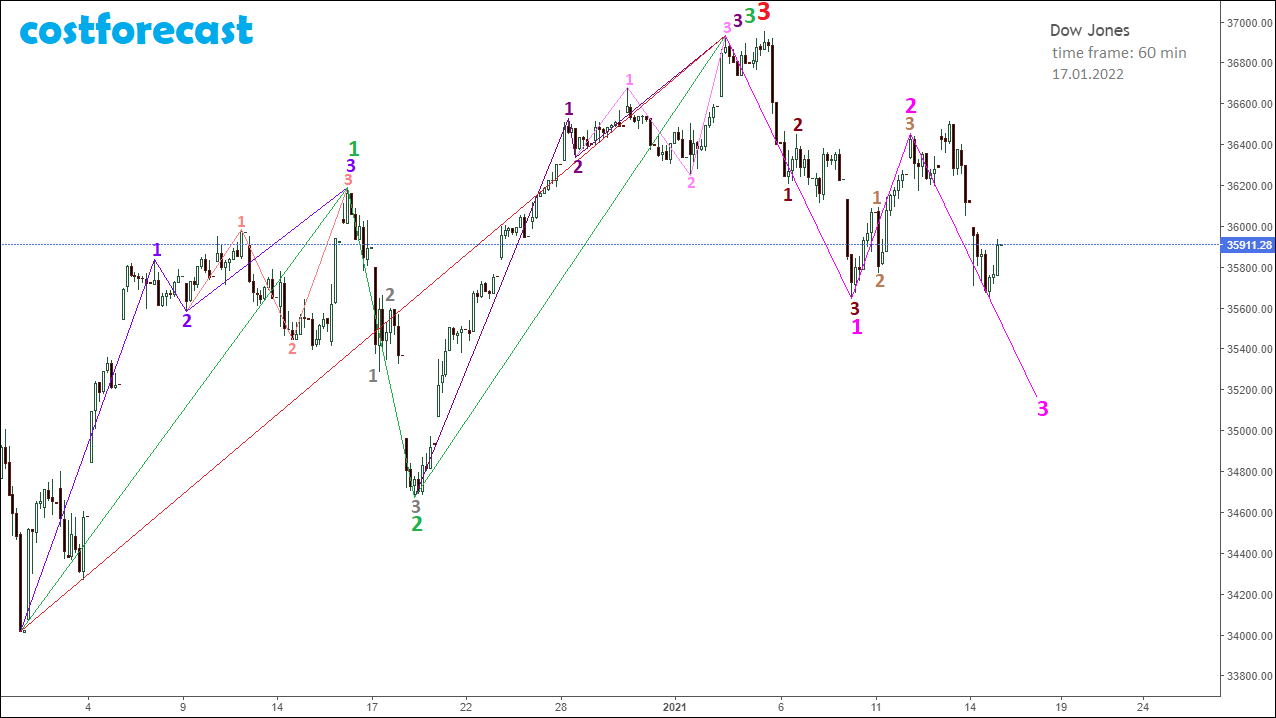
Thus, reading with the help of the Alphabet of Niro Attractors from the smallest to the largest orders of fractal structures of the graph of the dynamics of the Dow Jones index values gives an understanding of which fractal structures have formed, which fractal structures are being formed and which fractal structures will be formed.
Knowledge of the Alphabet of Niro Attractors and the ability to read charts of the dynamics of the value of the financial market gives an understanding of the possible future dynamics of the value of the short, medium and long term.
The Niro modeling method, based on chaos theory and fractal geometry, is a powerful technical analysis tool that allows you to effectively manage market risk and profitably invest in the financial market.


