
The Renaissance of Quantitative Trend Following: Deep Dive into Multi-Symbol Dynamics and Autonomous Equity Control

Abstract
In an era dominated by high-frequency algorithms and machine learning noise, the fundamental principles of trend following remain the most reliable path to long-term wealth compounding. This article provides a comprehensive technical breakdown of the Turtle Multi Pro, a modern evolution of the legendary Turtle Trading Rules. We explore the transition from single-asset trading to multi-symbol portfolio management and introduce the groundbreaking Equity Control (EC) Module—an autonomous management layer that treats the equity curve itself as a tradable asset.
Chapter 1: The Mathematical Foundation of the Turtle System
The original Turtle experiment was not just a lesson in psychology; it was a masterclass in Position Sizing and Volatility Calibration. At its heart lies the "N" value—the Average True Range (ATR).
1.1 The N-Value Calculation
The system calculates the 20-period ATR to determine the "noise level" of a symbol. This is crucial because it allows the algorithm to equalize risk across disparate assets. Whether trading Bitcoin (high volatility) or EURUSD (lower volatility), the dollar-at-risk per trade remains constant.
-
Formula:
Unit=(AccountEquity∗Risk%)/(N∗PointValue)
-
Objective: To ensure that a 1-N move in any symbol has the same financial impact on the portfolio.
1.2 The Logic of the Breakout
The system utilizes dual-timeframe breakouts (System 1 for short-term and System 2 for long-term). By entering on 20-day highs and exiting on 10-day lows, the strategy ensures it is always positioned on the side of momentum during a parabolic move.
Chapter 2: The Portfolio Effect—Overcoming the "Single-Pair Trap"
The most common reason retail trend-followers fail is "Strategy Stagnation." Every trend-following system goes through periods of "Chop"—a sideways market where breakouts fail repeatedly.
2.1 Cross-Symbol Decorrelation
By deploying the Turtle Multi Pro across Gold (XAUUSD), Bitcoin (BTCUSD), and major Forex pairs (USDJPY, GBPUSD), we leverage the power of Statistical Decorrelation.
-
Scenario A: Gold is consolidating during a low-inflation period.
-
Scenario B: At the same time, Bitcoin enters a massive bull run due to institutional adoption.
-
The Synergy: The profits from the BTCUSD trend not only cover the small stop-losses in XAUUSD but drive the overall equity to new all-time highs. This is the "Holy Grail" of quantitative finance—the ability to find non-correlated returns.
Chapter 3: Technical Breakdown of the Equity Control (EC) Module
This is the core innovation of the Turtle Multi Pro. Most EAs are "blind" to their own performance. They continue trading at the same intensity whether they are in a 10-trade winning streak or a 10-trade losing streak.
3.1 Trading the Equity Curve
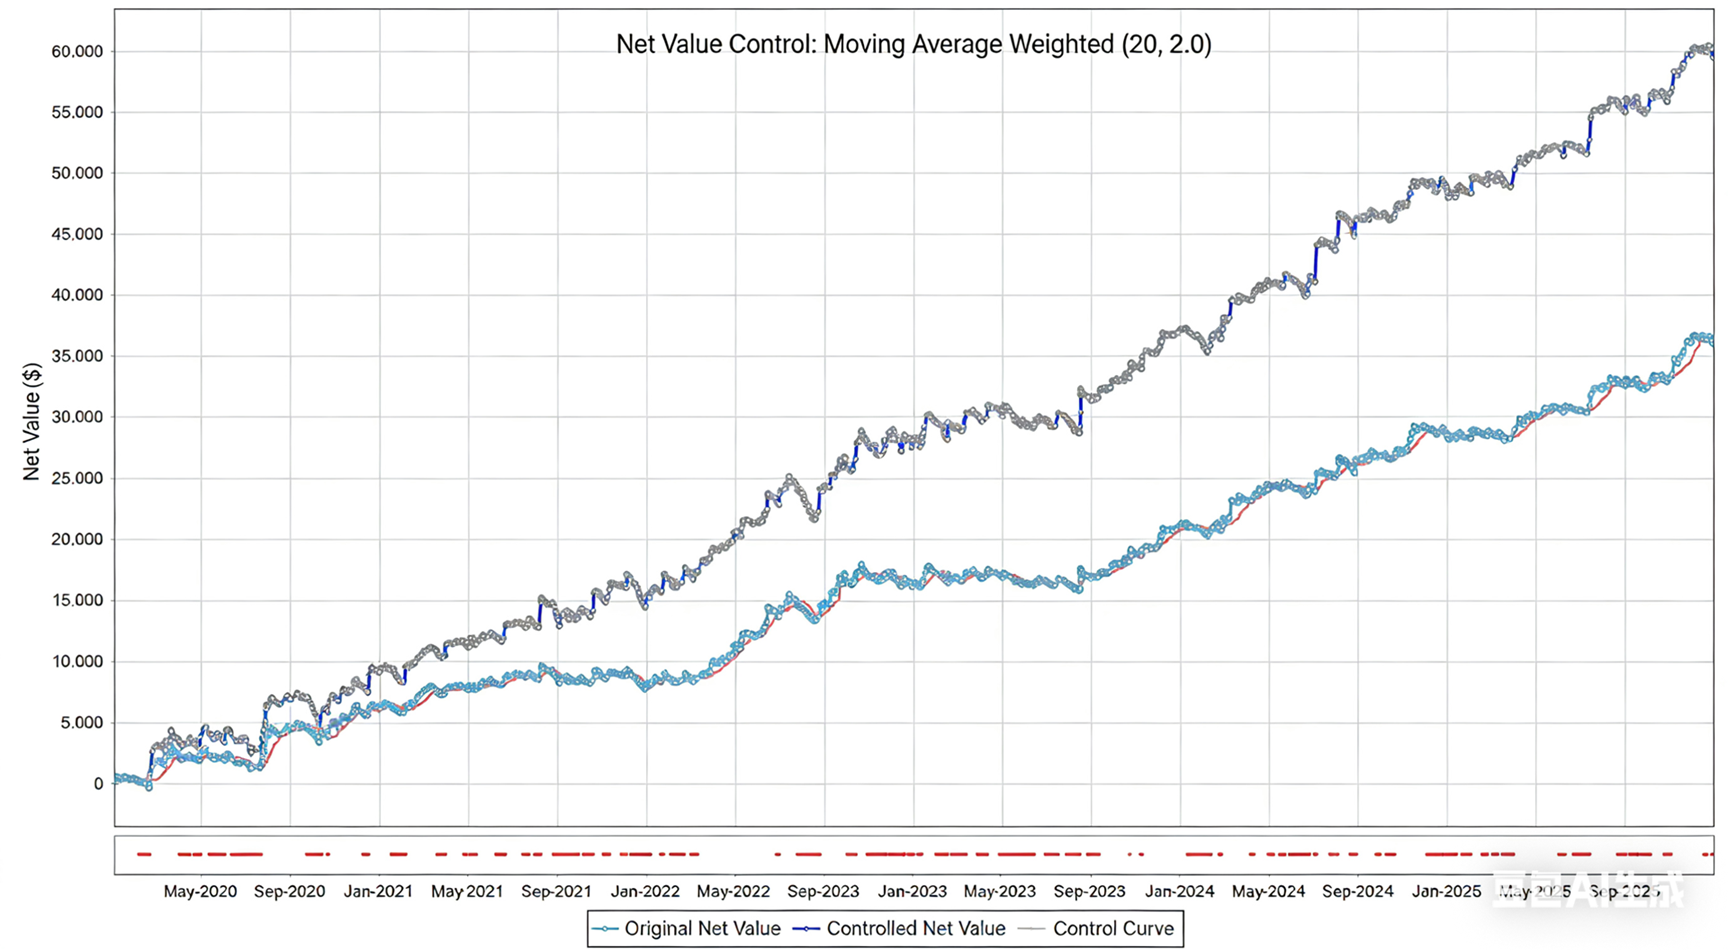
The EC Module treats the EA's performance history as a secondary price chart. It applies a Moving Average (Equity MA) to the net balance.
-
Expansion Logic (The Multiplier): When the current equity is above the MA, it signals that the strategy is "In-Sync" with current market volatility. The module applies a Coefficient (Multiplier 2.0). We "bet big" when the edge is sharpest.
-
Contraction Logic: When equity falls below the MA, it indicates a "Stagnation Phase." The EA reduces its risk profile to the baseline, protecting the capital while waiting for the next trend cycle.
3.2 Solving the Drawdown Dilemma
Standard EAs suffer from "Drawdown Fatigue." By the time the big trend arrives, the account is often too depleted to recover. The EC Module ensures that the EA is most aggressive at the start of a recovery phase, which is mathematically proven to be the most efficient time to apply leverage.
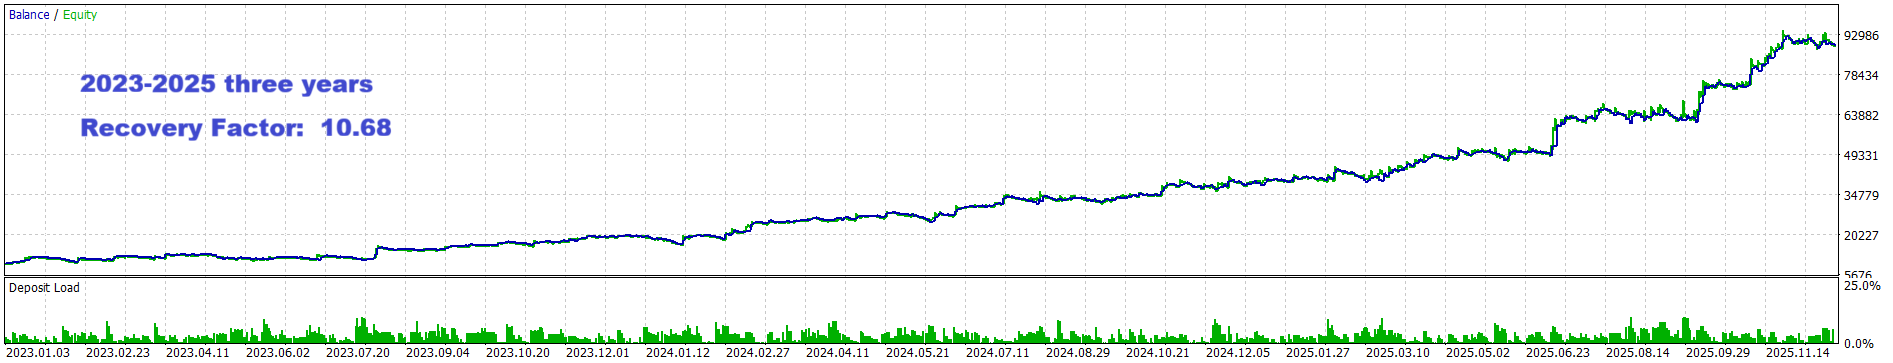
Chapter 4: Data Analysis—The 2023-2025 Stress Test
To validate the EC Module, we conducted an exhaustive 3-year backtest (2023-2025) using 99% data precision. This period included the post-pandemic inflation surge, the Bitcoin ETF approval, and extreme volatility in the Japanese Yen.
4.1 Global Portfolio Performance
-
Total Net Profit: $79,310.55 (on a standard starting balance).
-
Max Equity Drawdown: 10.66%.
-
Sharpe Ratio: 18.85.
-
Profit Factor: 1.58.
4.2 Deep Dive into Trade Distribution
Out of 834 trades, the win rate was approximately 48%. However, the Largest Profit Trade was $7,576, while the Largest Loss Trade was only $1,332. This 5.6:1 reward-to-risk ratio on big moves is the hallmark of a professional-grade trend follower. The EC Module amplified these wins specifically in late 2024, leading to the "Exponential Lift" seen in the equity curve.
Chapter 5: Advanced Risk Management & Capital Allocation
Risk is not a single number; it is a multi-dimensional concept.
5.1 The "Death by a Thousand Cuts" Prevention
In a choppy market, the Turtle Pro uses a "Triple Filter" system:
-
Donchian Filter: Prevents late entries into exhausted trends.
-
ATR Filter: Scales down positions if the market becomes too erratic.
-
EMA 25/350 Filter: Ensures the short-term breakout is aligned with long-term institutional flow.
5.2 Compounding vs. Fixed Lot
The system supports both. However, for accounts above $5,000, we recommend the Dynamic Percentage Risk. This allows the system to compound gains during winning streaks, which, combined with the EC Multiplier, creates a powerful wealth-building engine.
Chapter 6: The Psychology of Quantitative Execution
Why do people buy EAs and then turn them off? Drawdown Anxiety.
Even a system with a Sharpe Ratio of 18.85 will have losing days. The Turtle Multi Pro is designed to remove the human element. By automating the equity management, it prevents the trader from "revenge trading" during a drawdown or "scared trading" during a trend.
Chapter 7: Implementation and Optimization Guide
To achieve the results shown in the 2023-2025 reports, users must follow these protocols:
-
Symbol Selection: Choose a mix of Trend-Heavy assets. We recommend: XAUUSD, BTCUSD, USDJPY, and EURUSD.
-
Latency: Use a VPS located in London or New York (cross-connected to your broker). Breakouts are time-sensitive.
-
EC Module Tuning:
-
Set Equity MA Period to 20 for most accounts.
-
Set Multiplier to 2.0 if you seek aggressive recovery.
-
-
Monitoring: Use the built-in Dashboard to monitor the "Protection Mode" status.
Conclusion: The New Paradigm
The Turtle Multi Pro represents a paradigm shift in retail trading. By combining 40 years of Turtle wisdom with modern Equity Curve Trading technology, we have created a system that doesn't just survive the market—it learns from its own performance.
Quantitative trading is a game of probabilities. With the EC Edition, those probabilities are finally in your favor.
🔗 Access the System on MQL5 Market: Turtle Multi Pro (EC Edition)


")

![[XAUUSD]: Weekly Liquidity Activation Points (timings), June 22-26, 2026](https://c.mql5.com/6/1013/splash-preview-771790.png "[XAUUSD]: Weekly Liquidity Activation Points (timings), June 22-26, 2026")