Important questions answered below.
50+ but Which Patterns?
Below is the list of Patterns:-
| Bullish | Bearish |
|---|---|
| Bullish Hammer(1) | Bearish Hammer(1) |
| Bullish Hammer(2) | Bearish Hammer(2) |
| Bullish Hammer(3) | Bearish Hammer(3) |
| Piercing Pattern | Dark Cloud Cover |
| Bullish Engulfing | Bearish Engulfing |
| The Morning Star(1) | The Evening Star(1) |
| The Morning Star(2) | The Evening Star(2) |
| The Morning Star(3) | The Evening Star(3) |
| Three White Soldiers | Three Black Crows |
| White Marubozu | Black Marubozu |
| Three Inside Up | Three Inside Down |
| Bullish Harami(1) | Bearish Harami(1) |
| Bullish Harami(2) | Bearish Harami(2) |
| Bullish Harami(3) | Bearish Harami(3) |
| Tweezer Bottom(1) | Tweezer Top(1) |
| Tweezer Bottom(2) | Tweezer Top(2) |
| Inverted Hammer(1) | Hanging Man(1) |
| Inverted Hammer(2) | Hanging Man(2) |
| Three Outside Up | Three Outside Down |
| Bullish Doji | Bearish Doji |
| Bullish Spinning Top | Bearish Spinning Top |
| Rising Three(1) | Falling Three(1) |
| Rising Three(2) | Falling Three(2) |
| Upside Tasuki Reversal | Downside Tasuki Reversal |
| Bullish GCC | Bearish GCC |
Patterns do not simply form as described in a book. So different variations of the same Patterns can be seen. Also some slight modifications have been done to make Patterns more applicable on Forex Market.
What is Simulated Trading?
When a Pattern is identified then it is put to test with a Trading Algorithm(Not Real Trades opened) but a Simulation. It is given following three conditions to perform
- 10 Bars(or maximum available for most recent ones) to prove its efficiency
- Stop Loss at High or Low of the Pattern Bar for Sell or Buy respectively
- Minimum Take Profit of 1.5 x ATR(14 Period) and Maximum how much it makes within given Bars
From above conditions only three three results can occur
- Trade made Profit
- Trade made Loss
- No result = 0
The Simulated Trading results can be Printed in the Experts Tab. An Example below just for demonstration purpose

The Analysis Part
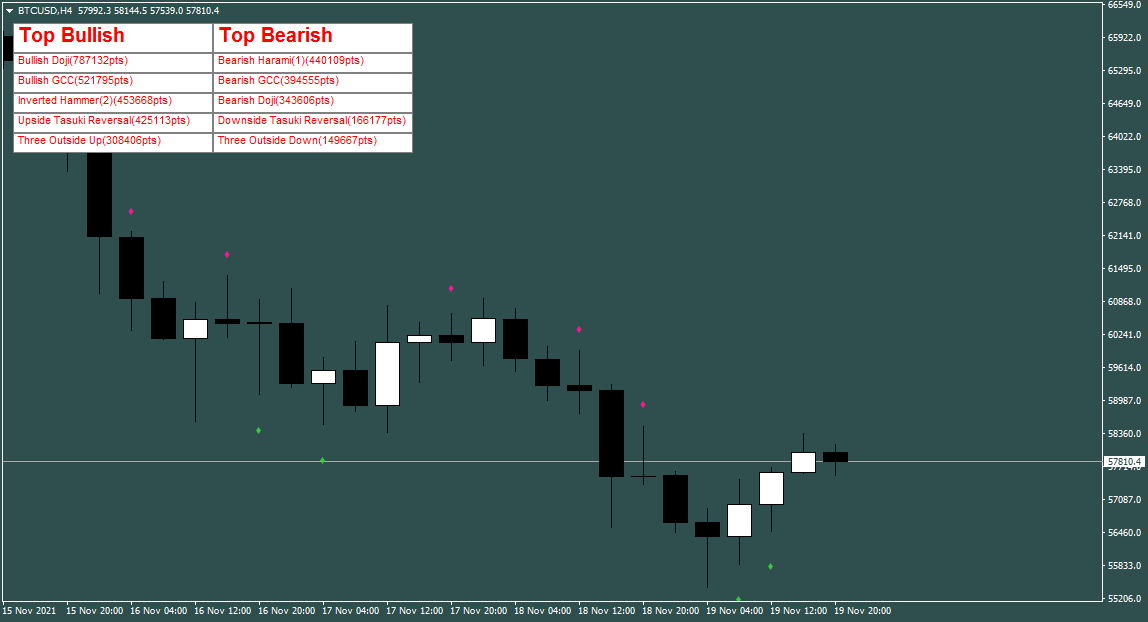
With the help of the Above mentioned Algorithm results are accumulated and Top Five Performers are declared which can be then displayed in the window. See example below

The Conclusion
Use the Performance Analysis of the past data and the Top Performers to increase probability. The Pattern names can be seen by hovering the mouse arrow over the dots.


