
TECHNICAL ANALYSIS at 14/08/2020 for EURUSD, GBPUSD, USDJPY
Morning Market Review 14/08/2020 EUR / USD, GBP / USD, USDJPY
For this analysis I use iPump indicator
https://www.mql5.com/en/market/product/39895
EUR / USD
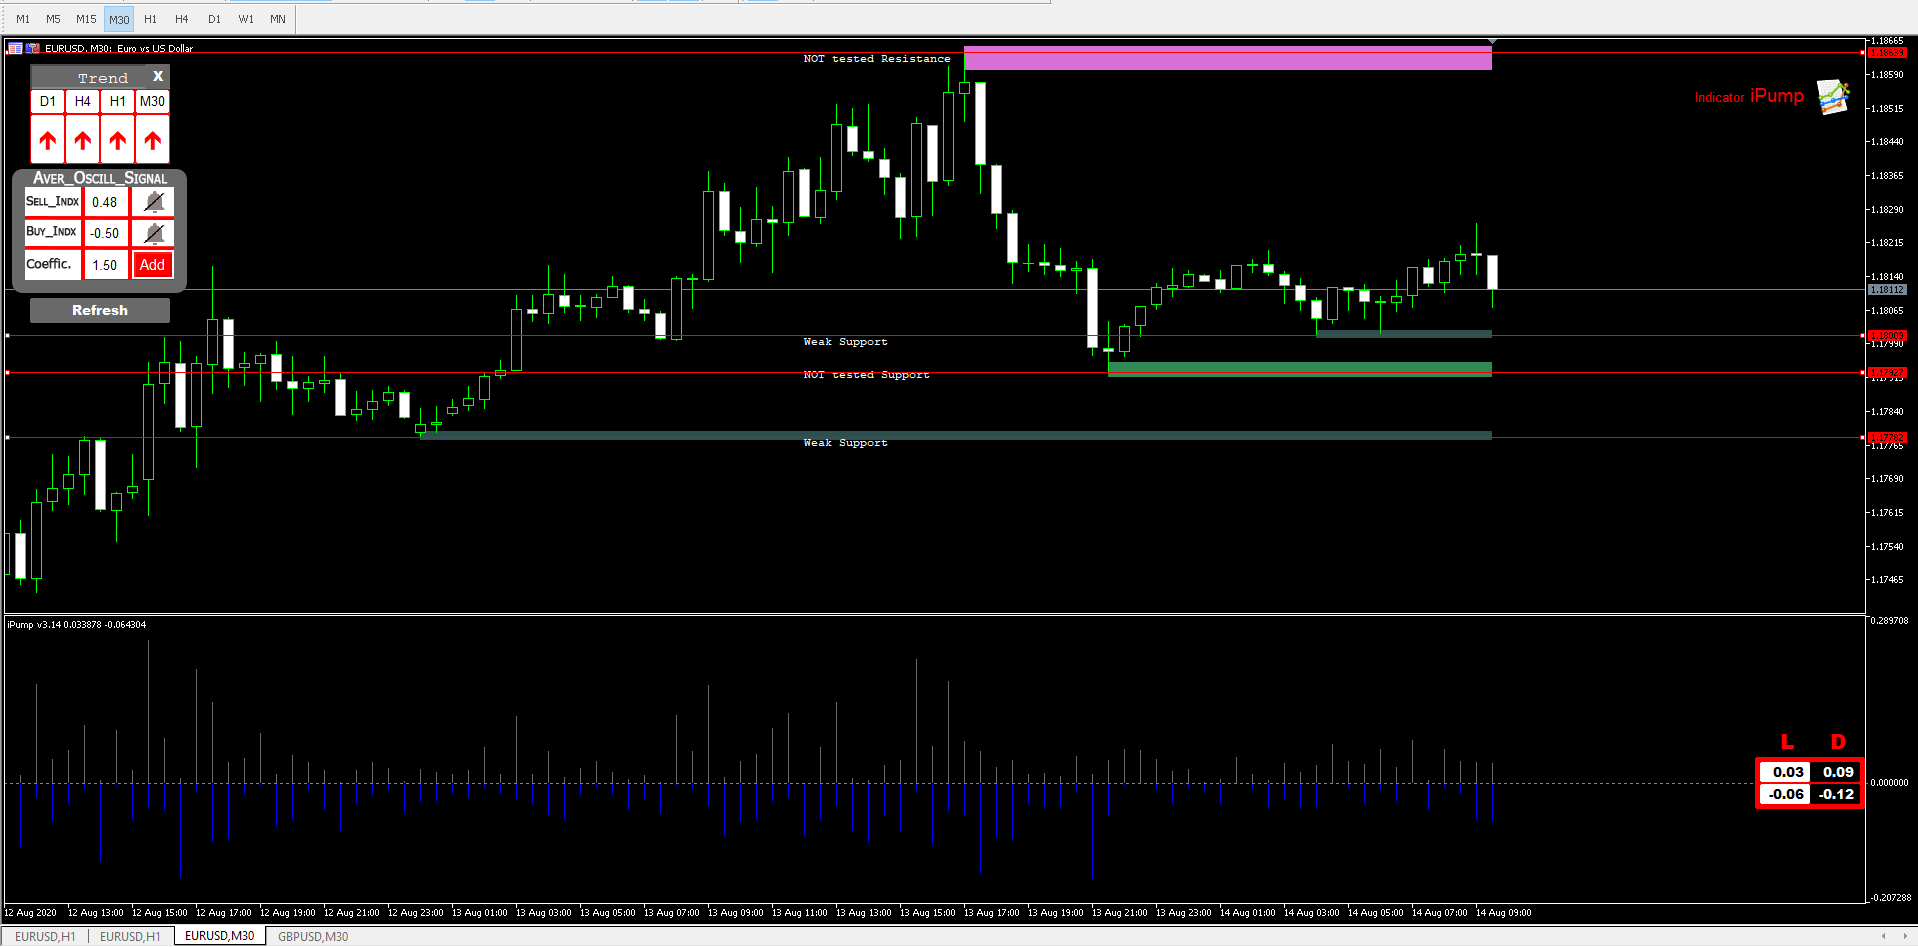
Yesterday the EUR / USD pair was trading higher and closed the day in positive territory around the $ 1.1810 price. Today the pair was trading in a narrow range of $ 1.1800-20, staying close to yesterday's closing price. On the hourly chart, EUR / USD continues to test the resistance - the moving average MA (200) H1 ($ 1.1800). On the four-hour chart, the pair remains above the MA 200 H4 line for now. Based on the foregoing, it is probably worth adhering to the southern direction in trading and until the pair finally consolidates above MA 200 H1, it is necessary to look for a sell entry point to form a correction.
The main scenario for the pair's advance is the continuation of the decline to $ 1.1755 (the minimum of the American session on August 12). An alternative scenario implies a final consolidation above the MA 200 H1, followed by a rise to $ 1.1860 (Aug 13 high).
GBP / USD
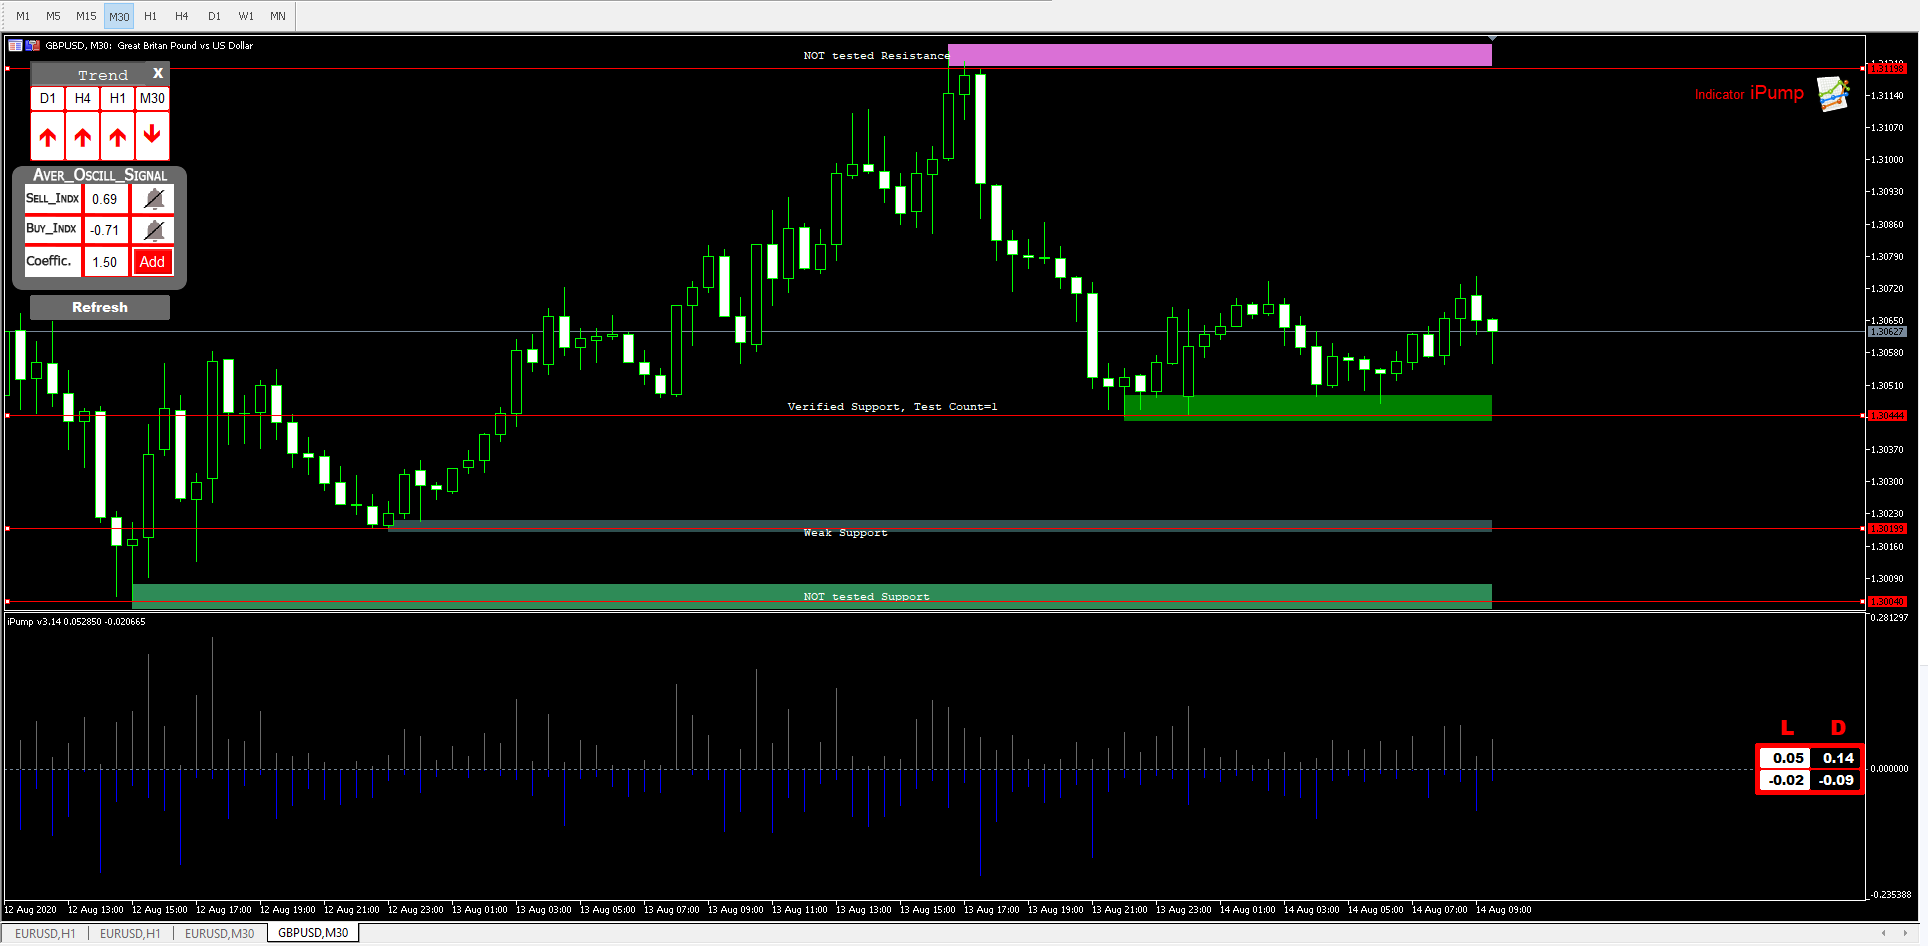
Yesterday the GBP / USD pair was trading higher and closed the day in positive territory around the $ 1.3065 price. Today the pair was trading in a narrow range of $ 1.3050-75, staying close to yesterday's closing price. On the hourly chart, GBP / USD is still trading below the MA line (200) H1 ($ 1.3080). On the four-hour chart, the pair remains above the MA 200 H4 line for now. Based on the foregoing, it is probably worth sticking to the south direction in trading, and while the pair remains below MA 200 H1, it is necessary to look for a sell entry point to form a correction.
Resistances are at levels: $ 1.3120-30, $ 1.3185-00, $ 1.3280
Support levels are located at: $ 1.3005, $ 1.2980, $ 1.2945
The main scenario for the pair's advance is the continuation of the fall to $ 1.3005 (August 12 minimum). An alternative scenario implies consolidation above the MA 200 H1 level with a subsequent rise to $ 1.3185 (Aug 6 high).
USD / JPY
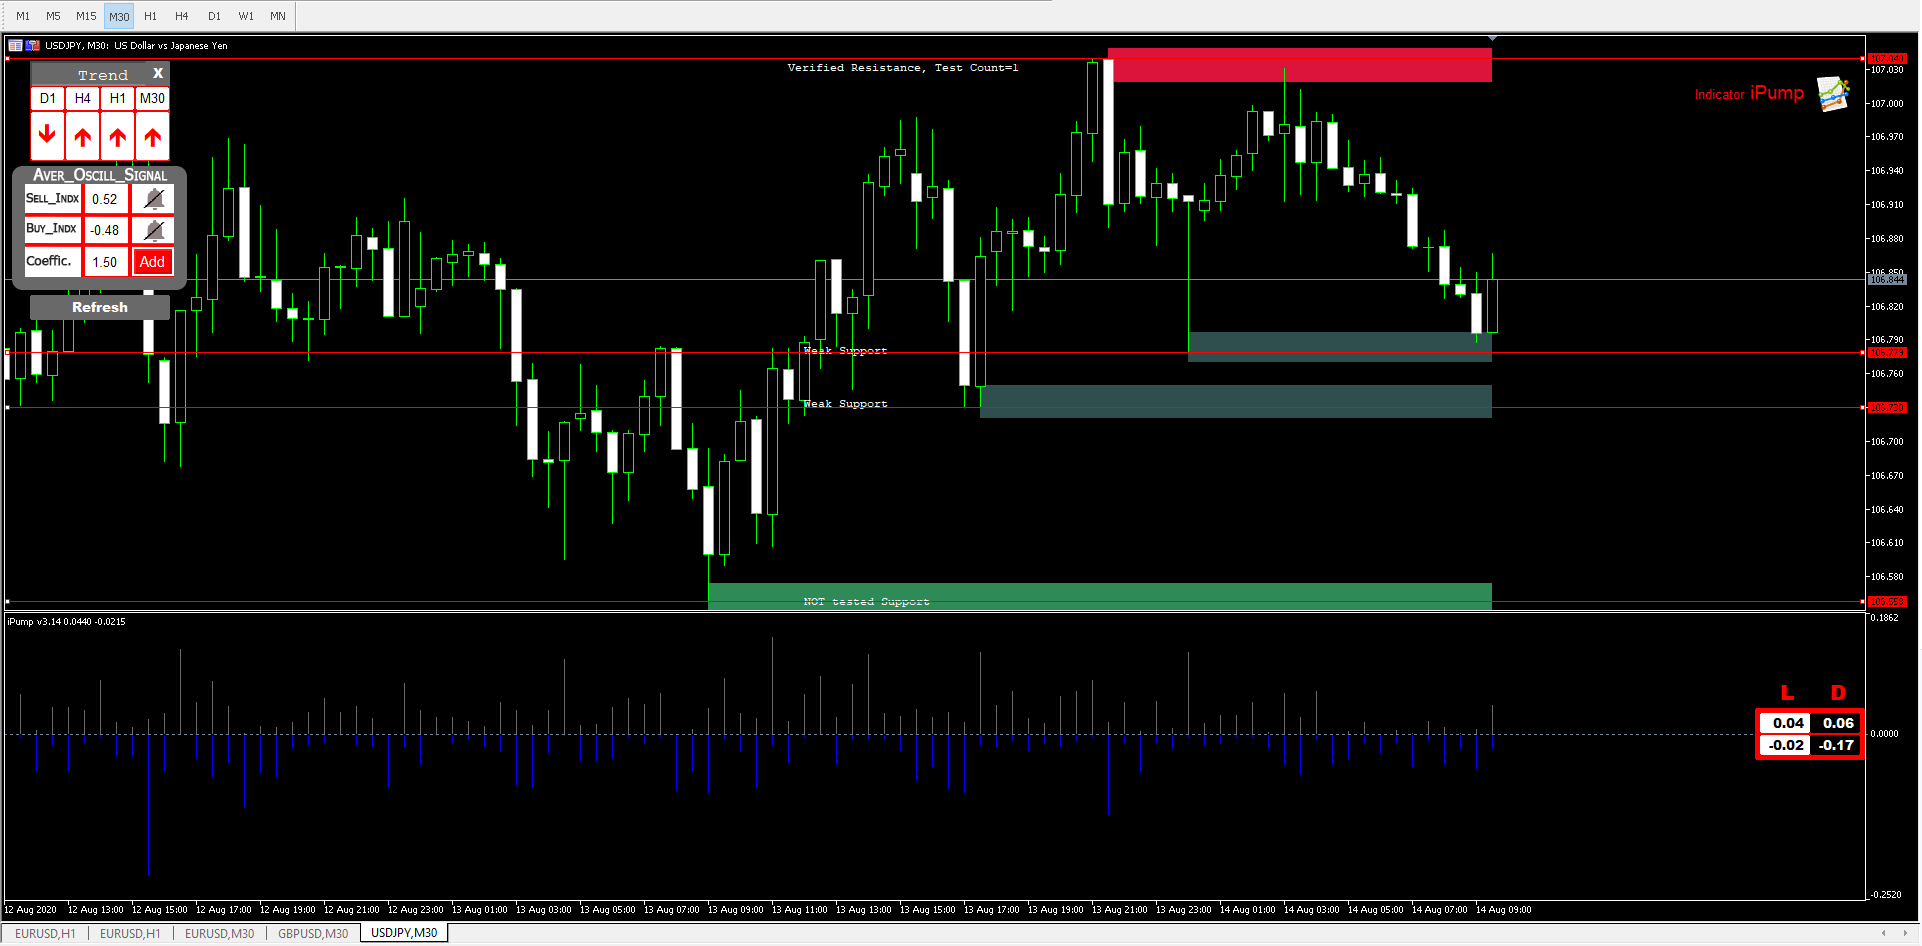
Yesterday the USD / JPY pair was trading higher and closed the day in positive territory around the price of Y106.90. Today the pair was trading in a narrow range of Y107.80, staying close to 3-week highs. On the hourly chart, USD / JPY is still trading above the MA line (200) H1 (Y106.10). The situation is similar on the four-hour chart. Based on the foregoing, it is probably worth sticking to the northern direction in trading, and while the pair remains above MA 200 H1, it is necessary to look for buy entry points to form a correction.
Resistances are at the levels: Y107.00, Y107.20-35, Y107.50
Support levels are located at: Y106.45-55, Y105.95, Y105.70
The main scenario for the pair's advance is the continuation of the upward movement to Y107.00 (maximum of August 13). An alternative scenario suggests consolidation below MA 200 H1, followed by a decline to Y105.55 (Aug 7 minimum).
![]()
The iPump indicator was used for the analysis
https://www.mql5.com/en/market/product/39895
#TECHNICAL ANALYSIS at 14/08/2020 for EURUSD, GBPUSD, USDJPY


")
")
")