Did you ever think that MetaTrader's standard tick graph is a bit defective? It displays only a limited number of ticks (up to 2000, I think), it's small and unscrollable, and it's in many other ways different to normal charts. Hence users can not analyse and use ticks in the same manner as they do with bars. Just to remind you, here is an example of the tick graph:

Tick graph in MetaTrader 5 Market Watch
I'm not a scalper, but I always wondered why ticks are not presented as normal charts, especially in MetaTrader 5, especially after real ticks support introduction. Some traders may think ticks are just small and fast noise, while the others prefer to take some profits on them. There is always a variety of approaches, and there is no reason why MetaTrader should favour ones over the others. After all, MetaTrader 5 is advertised as a platform for High Frequency Trading. So is it possible to handle ticks in the usual way: display in regular charts, scale, apply indicators and templates, trade using EAs at last?
Yes, we can do it by means of custom symbols. MQL API provides a couple of useful functions for this, such as CopyTicks, and CustomRatesUpdate. Of course, programming such a thing is a little bit routine task. For your convenience I'm providing here a tool for relaying real ticks to custom symbol charts, where every M1 bar represents a single tick. You may find source code - Ticks2Bars.mq5 - at the bottom of the page. This is a non-trading EA, generating a special custom symbol for you. For example, if you place EA on EURUSD chart, it will generate EURUSD_ticks. The code utilizes the header file Symbol2.mqh, which is attached below as well.
Inputs
- Limit - number of bars (ticks) to fill in at start, default - 1000; you can set Limit to 0, if LoopBack (see below) is off, then the ticks will start collecting from zero;
- Reset - boolean flag to enable complete refresh of all bars at start, default - true;
- LoopBack - boolean flag to enable circular buffer mode, in which old ticks (exceeding the Limit) are pushed off the internal "quotes" array when new ticks are added at its beginning, that is the chart does always contain Limit bars; default is true; Limit should be larger than 0, when LoopBack is enabled; if it's false, the internal array will be expanding constantly and number of the bars will grow;
- EmulateTicks - boolean flag to enable new tick event emulation on the custom charts, which is important for triggering EAs, default - true;
- RenderBars - a method of displaying bars: OHLC, or HighLow; OHLC is default; it shows ticks as complete bars with bodies (high = ask, low = bid, last (if any) = close; if last = 0, then open and close are determined as equal to high or low, depending from price movement since previous tick); HighLow shows ticks as pin bars with high = ask, low = bid, open = close = (ask + bid)/2; you may introduce another methods as you wish.
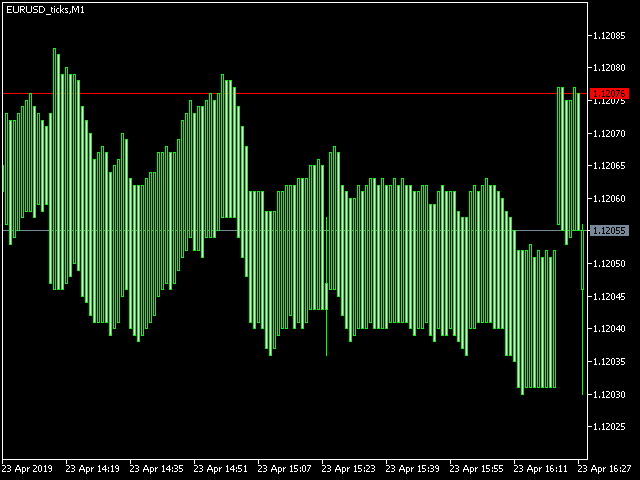
Here is how the custom tick chart looks like (compared to standard tick graph side by side):

Fully functional real tick chart in MetaTrader 5 (click to enlarge)
As you can see, we can apply built-in and custom indicators on the chart as usual.
One important note to be made - the time axis on the tick chart is fictious. Don't look at it. When LoopBack is true, the latest bar time is always current date and time up to minute, and all other bars are in past. When LoopBack is false, the bar times are constantly incremented starting from the moment when EA was started, and all bars over the Limit are in virtual future, also with 1 minute step.
Nevertheless, the rightmost M1 bar corresponds to the latest rightmost real tick and actual "close" price. This is why it's possible to trade on this chart with an EA online and even test EAs in the tester. The only thing you need to make it happen is slightly modify your EA. Indeed, EA placed on the custom chart should trade not on "XY_ticks" instrument, but on underlying "XY". In the example above, "EURUSD_ticks" should be replaced with "EURUSD" in all trade requests. In one of my previous blog posts I have already described a couple of methods how EA can be adapted to trade on a custom chart.
Apart from the need to modify EAs, the other drawback of the tick chart is that it's quickly updated, so it's hardly possible to add objects or make other markup on it manually. All analysis should be made dynamically with some automated tools.
I suppose most of scalpers implement ticks processing in their EAs by special structures for buffering, calculation, and signals generation. Now the same strategies can be implemented in standard way by accessing "tick quotes" and delegation of calculations and signaling to indicators.