
Since the beginning of the year, the pair USD / JPY is trading in the range between the levels 115.00 and 108.00, always returning to the balance line at 111.00. Near this level passes EMA200, EMA144, and EMA50 on the daily chart.
Recently, the level of 111.00 also passes EMA200 and the top line of the descending channel on the 4-hour chart and the top line of the descending channel on the daily chart.
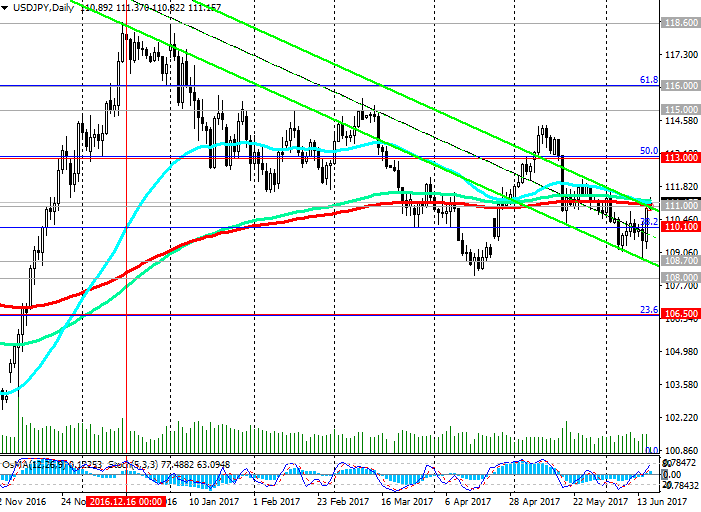
Today, the pair USD / JPY broke this level and traded at the beginning of the European session near the level of 111.20.
Indicators OsMA and Stochastics on the 4-hour and daily charts went to the side of buyers.
If the pair USD / JPY can gain a foothold above 111.00, then its growth may continue with the targets of 113.00 (Fibonacci level 50% correction to the pair growth since August last year and the level of 99.90, and the upper limit of the descending channel on the daily chart), 115.00 (top border of the range), 116.00 (Fibonacci level 61.8%), 118.60 (December and January highs), 121.30 (highs of January 2016).
An alternative scenario will be associated with the rebound from the level of support at 111.00 and the return of the pair USD / JPY in the descending channel on the daily chart. The objectives of the decline are the levels 110.10 (Fibonacci level 38.2%), 108.70 (EMA200 on the weekly chart), 108.00 (April lows), 106.50 (the Fibonacci level of 23.6%), the breakdown of which will finally return the pair USD / JPY in a downtrend.
So far, the positive dynamics of the pair USD / JPY is dominating. Preferred are the long positions.
It is likely that the pair USD / JPY will continue to grow in the near and medium term against the backdrop of the difference between the monetary policy of the Fed and the Bank of Japan.
Nevertheless, it should not be forgotten that the yen enjoys the status of a safe haven, and demand for it can rise sharply during periods of geopolitical tensions or instability in financial markets. Therefore, against the backdrop of the emerging bull trend of the pair USD / JPY, periods of active downward correction are highly probable.
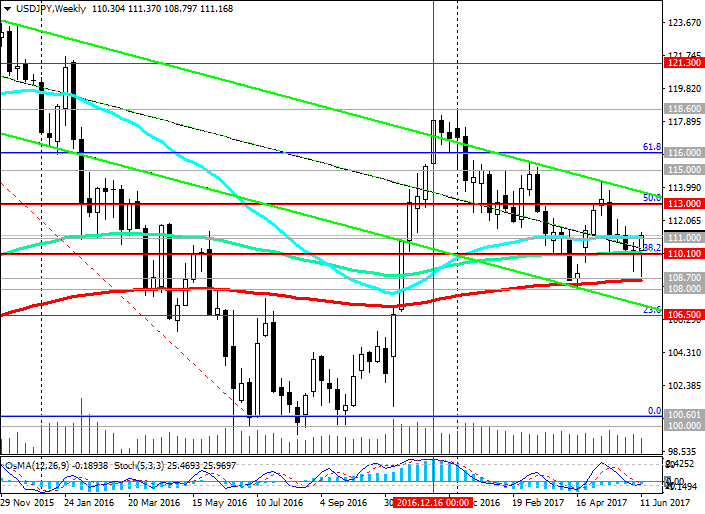
Support levels: 111.00, 110.10, 109.00, 108.70, 108.00, 106.50
Resistance levels: 111.80, 113.00, 114.00, 115.00, 116.00
Trading recommendations
Buy Stop 111.40. Stop Loss 110.80. Take-Profit 111.80, 113.00, 114.00, 115.00, 116.00
Sell Stop 110.80. Stop Loss 111.40. Take-Profit 110.10, 109.00, 108.70, 108.00, 106.50


")
![[XAUUSD]: Weekly Liquidity Activation Points (timings), June 22-26, 2026](https://c.mql5.com/6/1013/splash-preview-771790.png "[XAUUSD]: Weekly Liquidity Activation Points (timings), June 22-26, 2026")
")