

For successful trading RiverScope allows you to make decisions based on the current location within the price support and resistance zones, in the context of market, additional levels (bank, the minimum and maximum prices of the previous day), and the identification of price action patterns.
Levels of support and resistance are defined on own calculation algorithm and filtering of the historical values of the prices, its character of the movement, trading volumes, etc., display the current situation, so the levels change depending on the current price in real time.
Capabilities
- flexible configuration of any timeframe for the calculation of the Main and Extra areas of support and resistance


| 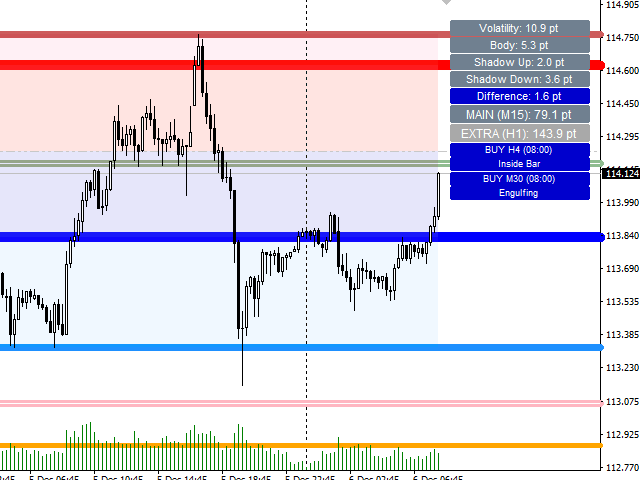  |
Additional levels
RiverScope displays such additional levels as the Bank level, as well as the levels of minimum and maximum prices of the previous day. Quite often, these levels can act as a "reversal" for intraday trends. The minimum and maximum price is understandable, but Bank level is determined by the closure of the first hour of the previous day and depending on the hour candle (bullish or bearish) the indicator displays on the chart the color of this level (green or red)
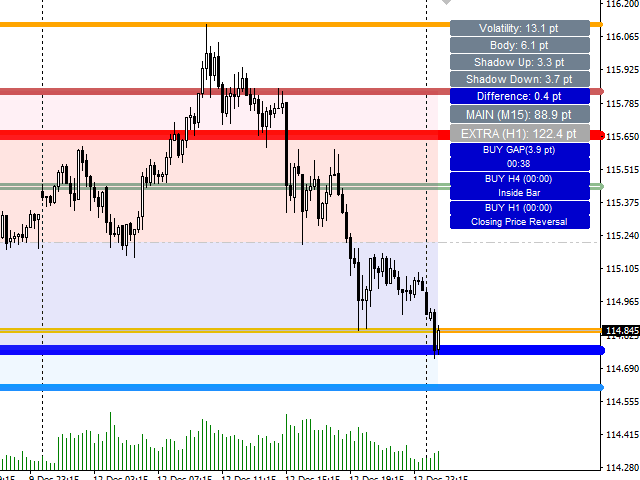
Price GAP
Based on the analysis of historical data, depending on the instrument traded and the type of the GAP (Common GAP, Breakaway GAP, Runaway GAP, Exhaustion GAP) "are closed":
- in the short-term prospects (up to 6-8 hours) more than 70%
- in the medium-term prospects (over 12 hours) more than 85%
Also, if you trade the GAP, it is necessary to pay attention to General rules of zones of its occurrence:
- if it opened after a long trend, it can signal (with high probability) of the trend reversal
- if it opened in the early trends in the breakdown of the previous low/high or after the opposite good volume of purchases/sales, then most likely the trend will continue to evolve
When the indicator is running, or when you switch the timeframe on the chart, RiverScope analyzes the presence of the GAP over the last hour.
RiverScope is also useful in that it reveals hidden GAPs, for example in the current timeframe of the chart with a large period is shown a long candle inside of which a GAP opened up, which you can see only if you switch to minimal periods (M1, M5).
If a GAP "opened" up on the fundamental news and is constantly increasing according to the established trend, then You can cancel tracking this GAP by click the left mouse button on the relevant information field.
Price Action
Price charts reflect the mood and opinions of all market participants, which are expressed in the form of different, historically repeated graphic formations. These formations, repeating in price movements, provide an opportunity to understand the current the state and dynamics of the market and “tell” us the PROBABILITY of continuation or change of movement direction.
RiverScope analyzes and detects these patterns in two modes: normal and with additional filtering (character movement, volume, etc.)
Also in the indicator parameters you can select the timeframe at which to start to determine patterns (for example if you trade on M15-30, you can start to identify patterns from M5 to exclude the M1 timeframe which can be a high level of "noise")
Due to the fact that the trading strategy using Price Action formations gives the PROBABILITY of subsequent market movements, so for successful trading it is recommended to pay attention to what areas (support/resistance) or close to what levels one or another pattern appears (especially reversal formations)
RiverScope gives complete information for such a complex analysis.
Update (add patterns)
The list of patterns defined by the indicator (version 1.10) :
- Engulfing
- Inside Bar
- Belt Hold
- Rails
- DBLHC & DBHLC
- TBL & TBH
- Pin Bar
- Hammer
- Shooting Star
- Morning Star
- Evening Star
- Piercing
- Dark-cloud cover
- Doji
- Tweezers Top & Bottom
- Key Reversal
- Open-Close Reversal
- Hook Reversal
- Island Reversal
- Pivot Point Reversal
- Closing Price Reversal
- 4B1B Pivot
- Complex Pivot Point
- Move-Congestion-Move
- Three Inside Up & Down
- Kicker
- Three BlackCrows & WhiteSoldiers
- Three Line Strike
- Abandoned Baby Top & Bottom
- Three Outside Up & Down
- Stick Sandwich
- Squeeze Alert
- Rising & Falling Three Method
The indicator will be improved and supplemented, including new patterns
https://www.mql5.com/en/market/product/21257
Short video


")
