

Trading recommendations
Sell in the market. Stop-Loss 0.7715. Take-Profit 0.7640, 0.7600, 0.7560, 0.7500, 0.7460
Buy Stop 0.7715. Stop-Loss 0.7670. Take-Profit 0.7760, 0.7800, 0.7840
Overview and Dynamics
On Tuesday, the Australian currency gained double support and grew in the currency market.
The short-term indicator of the economic situation in the country, which is the index of conditions in the business environment, for January came out with a value above the forecast (16 vs. 11 forecast). Business conditions in Australia in January turned out to be the best in nine years. Another similar index of business confidence index rose from 6 to 10 three-year high.
Despite the fact that Australian economic indicators in recent years have been disappointing - GDP growth in Q3 slowed down, and unemployment over the past few months has grown - the business climate in Australia remains high.
Also, the Australian dollar on Tuesday supported China's inflation indicators, which rose in January, the consumer prices rose in China in January at the fastest pace in more than two years. Producer prices in January rose highest rate in five years. The producer price index increased in comparison with January of the previous year by 6.9% after rising 5.5% in December.
China is an important trade and economic partner of Australia. And so the publication of the Chinese macroeconomic indicators is almost always sensitive to the Australian dollar.
However, caution must be exercised when making purchases rising Australian dollar. The January employment data in Australia, published Thursday (00:30 GMT), may be weak. The unemployment rate has increased in the past few months. If the unemployment rate exceeds the current level of 5.8%, the central bank will have to consider the possibility of further reduction in interest rates.
And this is a negative factor for the Australian dollar. Also today, market participants will be watching the performance of Fed Chairman Janet Yellen before the US Congress, which will begin at 15:00 (GMT). Janet Yellen will answer questions about the state of the US economy, the impact on it of a new economic policy of Donald Trump. Investors estimate the probability of the Fed raising rates in March to 18%. If Janet Yellen hint at a rate hike at the March meeting of the Fed, the US dollar could dramatically strengthen the foreign exchange market, including the pair AUD/USD.
As noted yesterday, Dallas Fed President Robert Kaplan, the Fed may not be able to contain price pressures, if the delay in measures to tighten US monetary policy at a later date.
Technical analysis
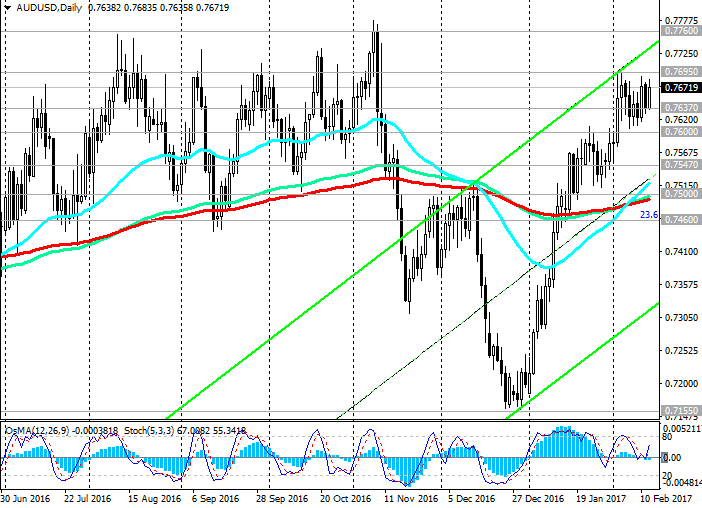
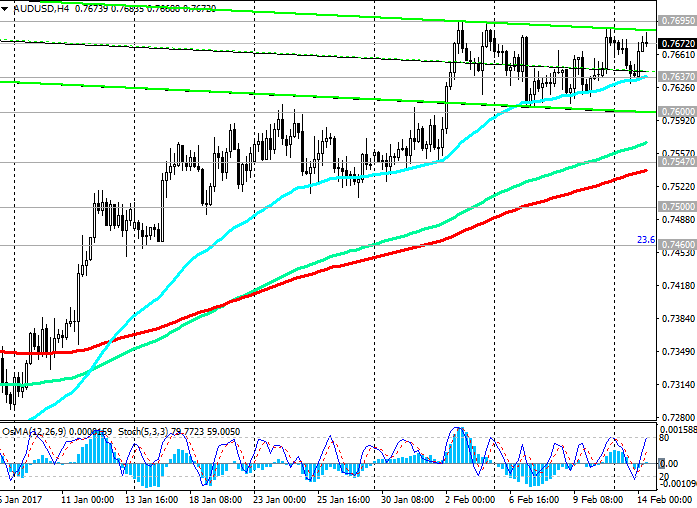
With the opening of today's trading day during the Asian session, AUD / USD pair rose. On the weekly chart indicators OsMA and Stochastic remain on the side of buyers. However, caution must be exercised when approaching pair AUD / USD to the 0.7695 resistance level, which is possible rebound.
So far, the pair AUD / USD rising in an upward channel on the short 1-hour chart is above the support level of 0.7637 (EMA200 and the lower boundary of the rising channel on the 1-hourly chart).
Positive dynamics of the pair AUD / USD maintained. However, a break of support level 0.7637 could signal a reversal in the downward trend.
Likely target will be the level of support then 0.7500 (EMA200 on the daily chart). While the pair AUD / USD is above this important support level, the medium-term positive dynamics of the pair is maintained. The breakdown of the level 0.7460 (23.6% Fibonacci level of the correction to the wave of decrease in pair in July 2014) will increase the risks of a pair of return AUD / USD in a downtrend the descending channel on the weekly chart, the lower boundary of which is below the level of 0.7025.
In case of continuation of the bullish trend and consolidate above the 0.7695 upside target pair AUD / USD will be the level of 0.7840 (Fibonacci level of 38.2% and EMA144 on the weekly chart), and in case of breakdown - the level of 0.8070 (EMA200 on the weekly chart).
Support levels: 0.7637, 0.7600, 0.7560, 0.7500, 0.7460, 0.7395, 0.7350, 0.7320, 0.7260, 0.7200, 0.7155, 0.7140, 0.7100, 0.7025
Resistance levels: 0.7695, 0.7760, 0.7800, 0.7840
Author signals - https://www.mql5.com/en/signals/author/edayprofit
*)presented material expresses the personal views of the author and is not a direct guide to conduct trading operations.


