

DailyTrader is not really an aggressive "scalping" EA. Its strategy relies on the breakout of daily support and resistance levels.
A position can be hold ~2 hours on average, with a few trades per day and the stop-loss is generally of tens of pips (hundreds of points on a 5-digits symbol). This makes it suitable for the faster "Open Prices Only" testing model.
To this purpose, it's important to get enough and consistent historical M1 and H1 bars. The latter being needed if TrailingStop_Mode = ATR_TRAILING_STOP is set, because the EA makes use of the ATR indicator on the H1 timeframe to determine the relevant Trailing-Stop parameters.
To do that, the simplest way is to open "Tools" --> "History Center" window on the MT4 terminal, then select the symbol we are testing, double click on "M1" and "H1" timeframes and then click the "Download" button on the left-side. In this way the history bars will be downloaded from the MetaQuotes database and all prices recalculated consistently.
It will be safe at that point to quit MT4 and restart it again, so it can refresh all internal stuff. Then, we are ready to do the backtest as described below.
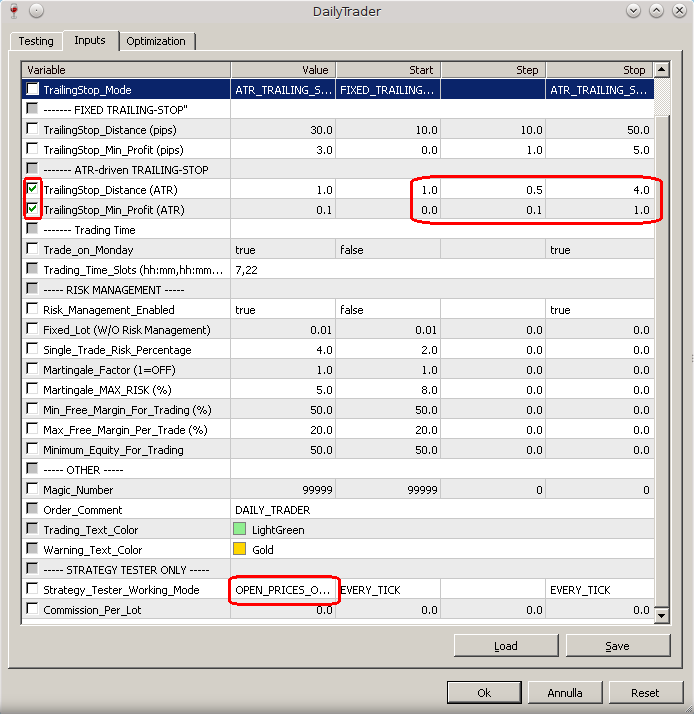
In the "Input" tab of the Strategy Tester window displayed after clicking the "Expert properties" button (see the Figure above), let's check the boxes of the two parameters to be optimized (TrailingStop_Distance (ATR) and TrailingStop_Min_Profit (ATR) ), and set the corresponding values interval and step (red-encircled), and then let's select "OPEN_PRICES_ONLY" mode and press OK.
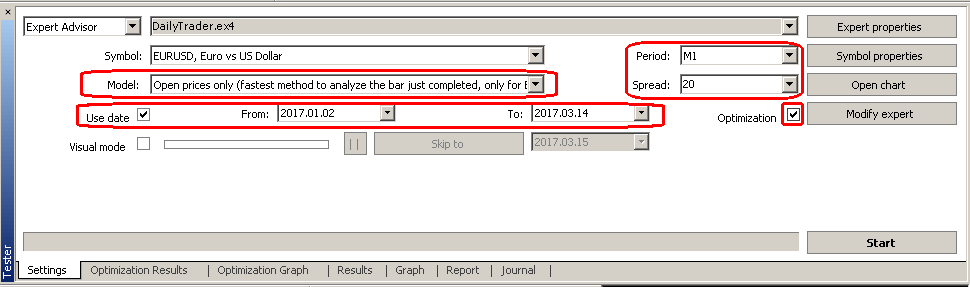
Then we can select the typical broker's spread (as in the Figure above), the M1 timeframe (for best accuracy), the "Open price only" model, check the "Use date" box and select the time interval to analyse, and finally we can press Start. At the end of the optimization run, we can take a quick look on the "Optimization Graph" to have a visual representation of the results. The darker the colored boxes the better the results. See the Figure below.
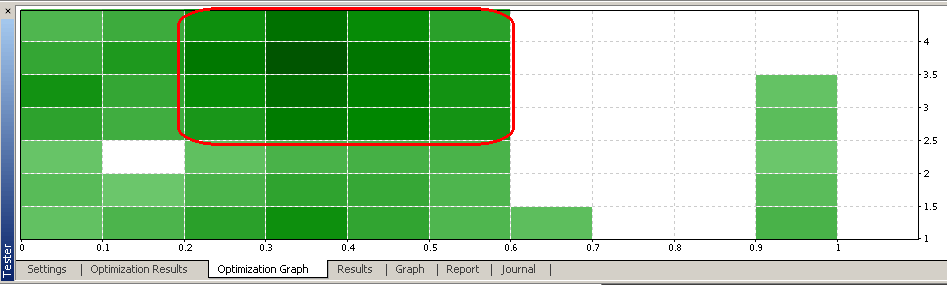
We can see that the best results are nicely distributed around the TrailingStop_Distance (ATR) = 3.5 and TrailingStop_Min_Profit (ATR) = 0.3 values (red-encircled region in the plot).
We can evaluate them in more details by clicking on the "Optimization Results" tab where they are listed in a given order (in this example I ordered them by the "Profit Factor"), as in the Figure below.

That allows us to choose the best pair of values taking also other parameters into account, for example the DrawDown, or the number of Total Trades, or the net Profit. Sometimes one gets huge profit factors but with a very low number of trades. Those results are poorly significant from a statistical point of view and they should be discarded.
In general, I would recommend to have at least 30 trades (distributed over at least three months) for such a test to be considered as significant. If the number of trades is too low, I would suggest to extend the testing period.
We can easily see the behavior of the balance in the backtested period for any one of the cases listed in the "Optimization Results", just by right-clicking with the mouse on the corresponding line of this list and then by clicking on "Set Input Parameter".
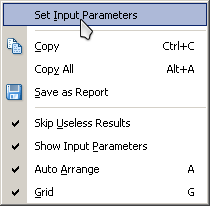
Then, the "Setting" window will automatically appear with that line's parameters already set for us. We will just need to press "Start" button and see how the balance behaves in the "Graph" window, as in the example below coming out having selected the first list line (with the highest profit factor).

To conclude, I would like to remind the interested trader that a freely downloadable version of the EA is available here, with the same features as the paid version, and that it can be used to do backtesting as shown in this blog.


 & AMD Framework")
")