 October-December 2016 Forecast: bullish ranging within the levels")
GOLD (XAU/USD) October-December 2016 Forecast: bullish ranging within the levels
27 September 2016, 10:11

5
261
W1 price is located above Ichimoku cloud in the bullish area of the chart. The price is on ranging within the following key support/resistance levels:
- 1375.11 resistance level located far above Ichimoku cloud in the bullish area of the chart, and
- 1302.36 support level located above Ichimoku cloud in the beginning of the secondary correction to be started on weekly chart.
Descending triangle pattern was formed by the price to be crossed to below for the correction to be started, but Absolute Strength indicator and Chinkou Span line of Ichimoku indicator are evaluating the future trend as the ranging bullish condition, and Tenkan-sen line located to be above Kijun-sen line
are indicating for the primary bullish trend to be continuing.
By the way, the bearish reversal level is 1171.88, and if the price breaks this level to below so the global bearish reversal will be started for this and next year for example.
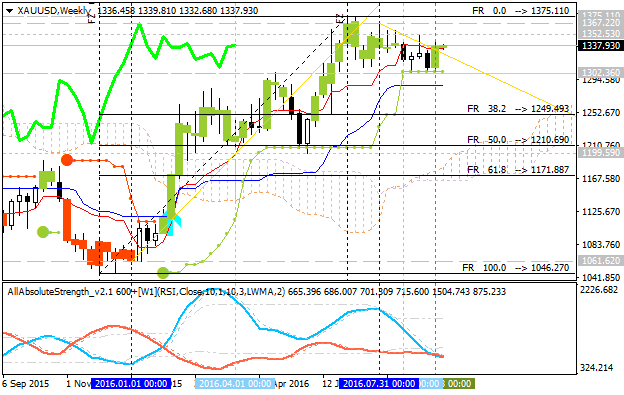
- If the price breaks 1375.11
resistance level on close weekly bar to above so the primary bullish trend will be resumed.
- If weekly price breaks 1302.36 support level on close bar to below so the local downtrend as the secondary correction within the primary bullish trend will be started.
- If weekly price breaks 1171.88 support level on close bar to below so we may see the reversal of the weekly price movement from the ranging bullish to the primary bearish market condition.
- If not so the price will be on bullish ranging within the levels.
| Resistance | Support |
|---|---|
| 1352.53 | 1302.36 |
| 1367.22 | 1210.69 |
| 1375.11 | 1171.88 |
Trend:


