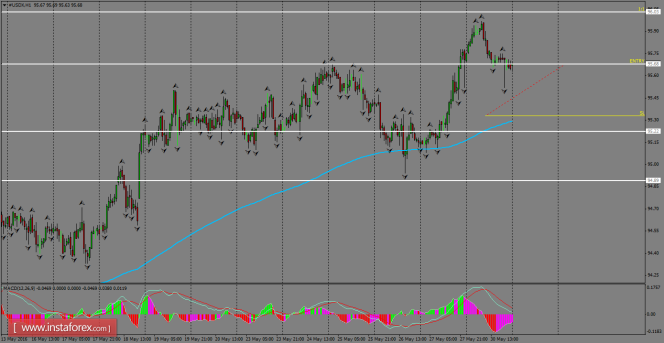
Daily Analysis of USDX for May 31, 2016
USDX pulled back at the start of the week, looking to correct the recent upside moves, and now we could expect another decline toward the 200 SMA price zone, which is very close to the support level of 95.22. However, a breakout can still happen to re-test the 96.03 level in coming days, and that could possibly open the doors to test the 97.00 psychological level.

H1 chart's resistance levels: 95.68 / 96.03
H1 chart's support levels: 95.22 / 94.89
Trading recommendations for today:
Based on the H1 chart, place buy (long) orders only if the USD Index breaks with a bullish candlestick; the resistance level is at 95.68, take profit is at 96.03, and stop loss is at 95.32.


