Daily Analysis of USDX for May 19, 2016
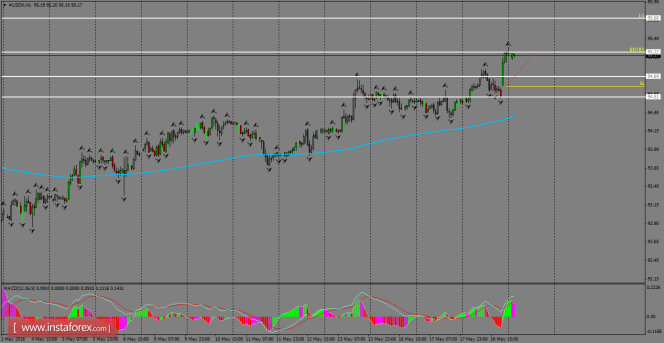
On the H1 chart, USDX has been trading into a bullish bias, after it received with a good shape the news from the FOMC minutes, which showed that a rate hike in June of this year is highly possible. The nearest resistance is located at the 95.22 level, where a breakout should happen to extend the rally toward the 95.68 level.

H1 chart's resistance levels: 95.22 / 95.68
H1 chart's support levels: 94.89 / 94.61
Trading recommendations for today:
Based on the H1 chart, place buy (long) orders only if the USD Index breaks with a bullish candlestick; the resistance level is at 95.22, take profit is at 95.68, and stop loss is at 94.76.
The material has been provided by 


