Daily Analysis of GBP/USD for May 16, 2016
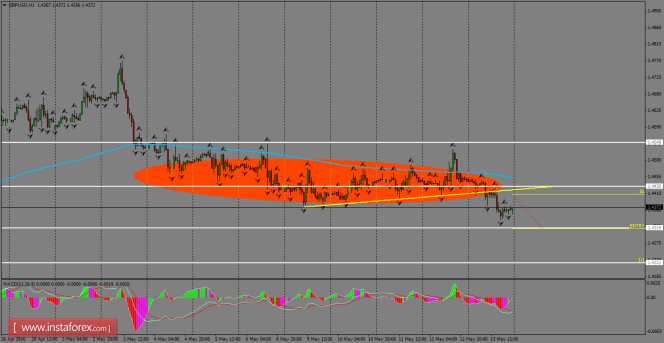
GBP/USD broke the bullish trend line projected from the May 9th lows, and now we can expect a decline toward the support zone of 1.4316. Also, we should note that the Cable has been trapped in a sideways structure, and Friday's move told us about a possible bearish continuation to reach new lows during this week. The MACD indicator is at oversold conditions.

H1 chart's resistance levels: 1.4430 / 1.4549
H1 chart's support levels: 1.4316 / 1.4222
Trading recommendations for today:
Based on the H1 chart, place sell (short) orders only if the GBP/USD pair breaks a bearish candlestick; the support level is at 1.4316, take profit is at 1.4222 and stop loss is at 1.4408.
The material has been provided by 


