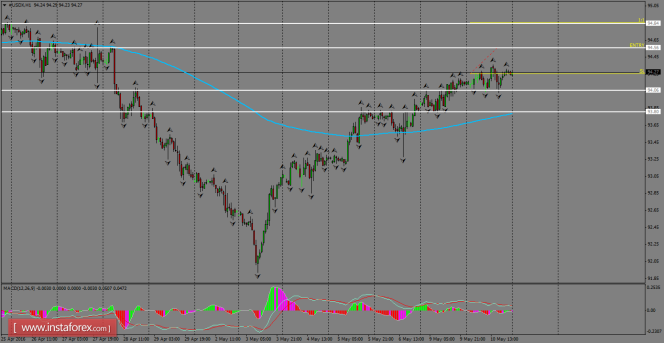
Daily Analysis of USDX for May 11, 2016
USDX is still trading in a bullish tone on H1 chart and a rally is expected to test the resistance zone of 94.56. The overall structure remains pointing to the upside as long as the Index breaks the strong resistance around the 94.56 level in order to rally toward the 94.84 level. 200 SMA is slightly bullish in this time frame, so we can expect more bullish moves in coming days, but be aware of possible deeper corrections.

H1 chart's resistance levels: 94.56 / 94.84
H1 chart's support levels: 94.06 / 93.80
Trading recommendations for today:
Based on the H1 chart, place buy (long) orders only if the USD Index breaks with a bullish candlestick; the resistance level is at 94.56, take profit is at 94.84, and stop loss is at 94.26.
The material has been provided by 


