
For analyzing the best pairs to trade looking from a longer term perspective the last 12 months Currency Classification can be used in support.
This was updated on 30 April 2016 and is provided here for reference purposes:
Strong: USD / JPY / CHF. The preferred range is from 6 to 8.
Average: GBP, NZD. The preferred range is from 4 to 5.
Weak: EUR, AUD, CAD. The preferred range is from 1 to 3.
______________________________________
12 Months Currency Score Strength for May 2016
The 12 Months Currency Strength and the 12 Months Average are provided here below. This data and the "12 months Currency Classification" are considered for deciding on the preferred range. Because it is not ideal nor desired to change the range for a currency every single week, we perform several checks to avoid this.
- First of all the strength over a period of 12 months. See each row for more information.
- Then the 12 months average, see the last row called "Avg. 12 M."
- The number of months that a currency is stronger than another currency can also be evaluated.
- The TA Charts for each Time Frame can also be consulted.
- Besides these the "12 months Currency Classification" chart of each currency is also consulted and compared.
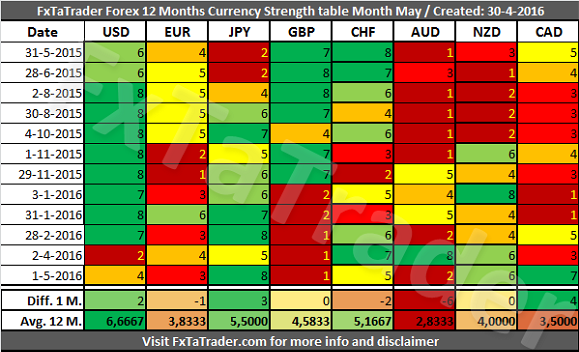
A switch took place in the Currency classification between the GBP and the JPY. The latter one has a higher "Avg. 12 M." score compared to the GBP.
- The JPY also had 6 times a higher score in the last 12 months. This happened in the last 5 months and in October 2015.
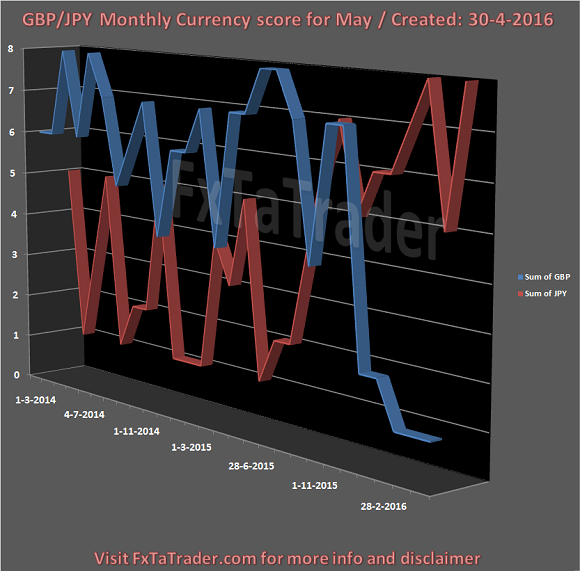
- When looking at the Classification chart itself it is clear to see that the JPY is stronger lately, the chart is provided here below.
- When looking at the Monthly and Weekly charts of this specific pair they are both showing a downtrend.
- The Monthy chart is nearing the Ichimoku Cloud and the pair is near the support level which was a resistance in the period Q2 and Q3 of 2013. The Tenkan-Sen is crossing the Kijun-Sen downwards. The MACD entered in negative area and the histogram is showing a lot of momentum.
- The Weekly chart is clearly in a downtrend and all signs are pointing down. The Ichimoku and MACD Indicators are clearly in a downtrend.
______________________________________
Currency Score Comparison for Month May 2016
"Comparison Table"
and the "Ranking and Rating list"
By using the comparison table directly below you can get a view without the volatility and statistics as opposed to the "Ranking and Rating List". Only the strength of each currency against the counterparts is analyzed by using the Technical analysis charts of the 3 Time Frames that are also used for the monthly "Ranking and Rating List".
The information from the Comparison Table is the source for calculating the monthly "Ranking and Rating List" where this list uses additionally the volatility and statistics for creating the best and worst performer in the list from number 1 to 28, whereby 1 is the best and 28 is the worst performer.
"Comparison
Table" and the "Currency Score Chart"
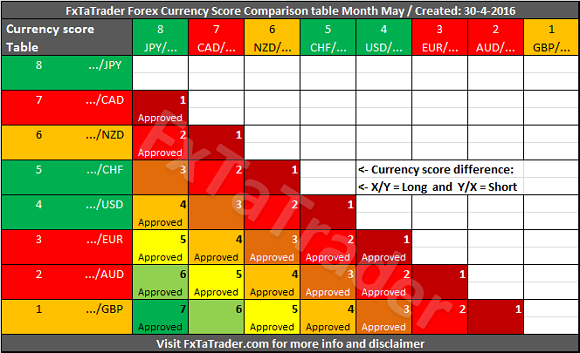
The Comparison Table provides a way to compare currencies from a longer term perspective of 12 months and also simultaneously taking the current trend into account. By coloring the currencies in the X and Y axis according to their Classification we can show what the best combinations are. In doing this we apply 2 rules to make it clearer.
- First of all only better classified currencies in combination with weaker classified currencies are "Approved".
- The only exception is when 2 currencies are similarly classified but the Currency Score difference is equal to or more than 4.
- It means that each currency should be as far apart from each other as possible in the range from 1 to 8. This means that the classification of the currencies in question may change in the longer term. By using the difference of 4 which is exact the half of the range it seems a safe approach for trading 2 currencies which are similarly classified.
- Since each classification covers only 2 or 3 scores at the most it means that the currencies should be at least one classification apart from each other in the current month.
- Even though they are in the same
classification when looking at the 12 months average a currency may be
in a weaker/stronger period and may even change its classification in
the future. See the current classification for the coming period at the
top of this article.
______________________________________
Putting the pieces together
Based on the last "12 months Currency Classification" and the "Currency Comparison Table" the most interesting currencies for going long seem to be the JPY, CHF and the NZD. These are strong or average currencies from a longer term perspective when looking at the last "12 months Currency Classification". For going short the same analysis can be done and the EUR, AUD and the GBP seem to fit best. These are weak or average currencies from a longer term perspective.Some of these pairs comply for a longer term trade based on the Monthly and Weekly chart. We will look at these ones here in a bit more detail. The ones that do not comply may be more interesting for the short term. See the article "Ranking, Rating and Score" for more details.
- When analyzing the Monthly and Weekly charts the best pairs to trade for the coming week seem to be the GBP/JPY, AUD/JPY, USD/JPY, CHF,JPY.
- A crossed join between the best pairs in the "Ranking and Rating List", the "Currency Comparison Table" and the pairs with the best charts mentioned here above shows the following interesting pairs: GBP/JPY, AUD/JPY, USD/JPY
- The CHF/JPY is not in the "Currency Comparison Table".
- The CHF/JPY is also not mentioned in the interesting pairs for the Ranking and Rating list.
- GBP/JPY with the AUD/CAD
- AUD/JPY with the GBP/CAD
- EUR/CAD with the GBP/JPY
- EUR/JPY with the GBP/CAD
However, if we compare these pairs only with the "Currency Comparison Table" they are almost all approved except for the GBP/CAD.
______________________________________
______________________________________
DISCLAIMER: The articles are my personal opinion, not recommendations, FX trading is risky and not suitable for everyone.The content is for educational purposes only and is aimed solely for the use by ‘experienced’ traders in the FOREX market as the contents are intended to be understood by professional users who are fully aware of the inherent risks in forex trading. The content is for 'Forex Trading Journal' purpose only. Nothing should be construed as recommendation to purchase any financial instruments. The choice and risk is always yours. Thank you.


