Technical Analysis of Gold for April 25, 2016
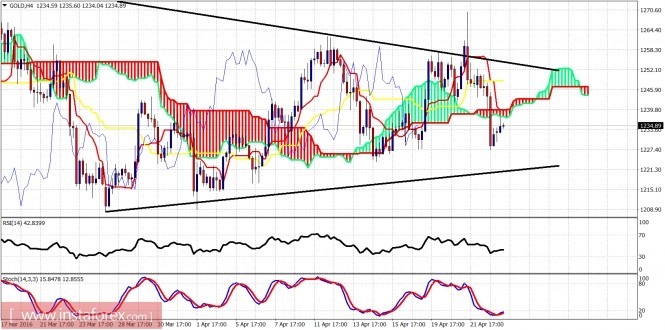
Gold remains trapped inside the trading range of $1,270-$1,220. Gold bulls have tried to push higher for a breakout but were not strong enough. Technicals are deteriorating and I continue to remain bearish as long as the price is below the $1,270 false breakout high we made last week.

Black lines - triangle
Gold price got rejected and made a false breakout last week which is a bearish sign. The price is below the 4-hour Kumo (cloud) again but also above the lower triangle boundary. Support is critical at $1,220. If broken, we should expect the price to move towards $1,190.

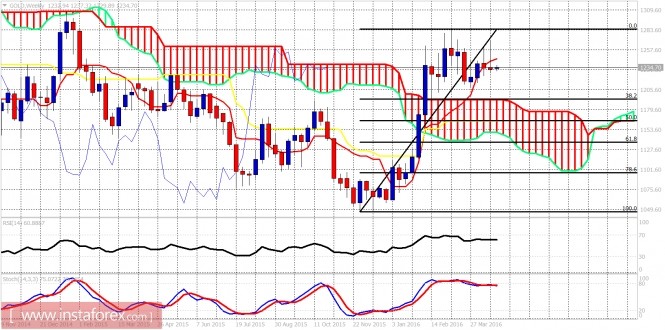
At $1,190 we find the weekly Kumo support and the 38% Fibonacci retracement. Stochastic is turning lower from overbought levels. The price closed below the tenkan-sen (red line indicator) again last week and this confirms the weakness in the Gold price. I expect at least a pullback towards the weekly Kumo. The ideal target will be the kijun-sen (yellow line indicator) at $1,160 which coincides with the 50% retracement.
The material has been provided by InstaForex Company - www.instaforex.com


