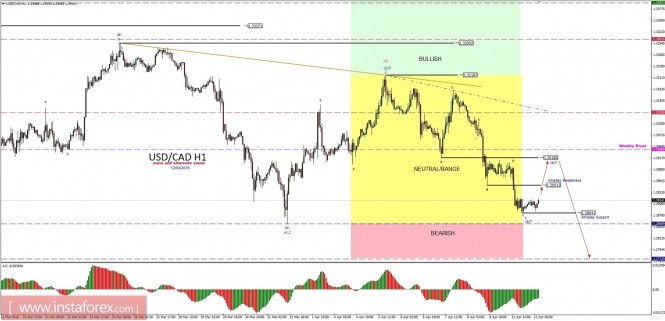
Technical Analysis of USD/CAD for April 12, 2016
General overview for 12/04/2016:
Five sub-waves in wave c of wave (a) had been completed and now the market should start the corrective cycle in wave (b). The projected target level for wave (b) is the previous wave 4 zone at the level of 1.3018. The main count is still the correct one and it indicated another possible downward wave progression towards the level of 1.2856. Nevertheless, this progression is currently developing in the yellow neutral zone and only a clear breakout below the level of 1.2856 will be considered bearish.

Support/Resistance:
1.2856 - WS1
1.2884 - Intraday Support
1.2951 - Intraday Resistance
1.3018 - Wave (b) Projected Target
1.3036 - Weekly Pivot
1.3126 - WR1
1.3218 - Local High
1.3295 - Swing High
1.3303 - WR2
Trading recommendations:
Day traders should buy the dips from the current market levels with SL below the level of 1.2850 and TP open for now. Please note that the trading inside of wave (b) might get choppy and full of fake breakouts.
The material has been provided by InstaForex Company - www.instaforex.com


