Technical Analysis of USDX for April 8, 2016
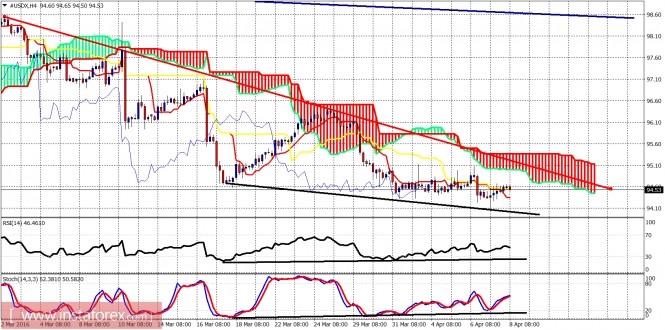
The Dollar index is showing signs of a possible reversal that is near. Several bullish divergence signals are given despite the new low. The trend remains bearish but dollar bears should be very cautious as a reversal could occur any time now.

Red line - resistance trend line
Black lines - bullish divergence signs
The Dollar index is still trading below the Kumo (cloud) on the 4-hour chart. The price is making lower lows and lower highs but the oscillators on the 4-hour chart are giving bullish divergence signals. Resistance is at 95. Support is at 94.20.

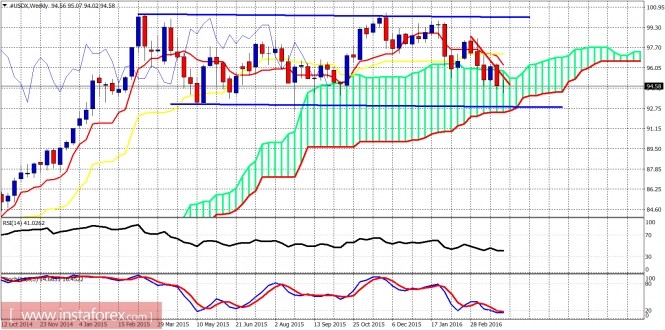
Blue lines - sideways channel
Red line - trend line resistance
The weekly candle is shaping to be a doji candle. This is a typical reversal candle but we have to wait for the weekly candle to close before reaching any conclusions. The short-term trend remains bearish. The long-term trend is neutral as the price continues to trade for at least a year inside the trading range. The weekly stochastic is also giving some bullish divergence signals and that is why dollar bears should be very cautious.
The material has been provided by InstaForex Company - www.instaforex.com


