Technical Analysis of Gold for April 8, 2016
Gold made an upward move yesterday towards the $1,240 critical resistance level but did not manage to break it. The weekly trend remains supportive but, in my overall view, long positions are preferred only after a deeper decline towards $1,170-$1,100.

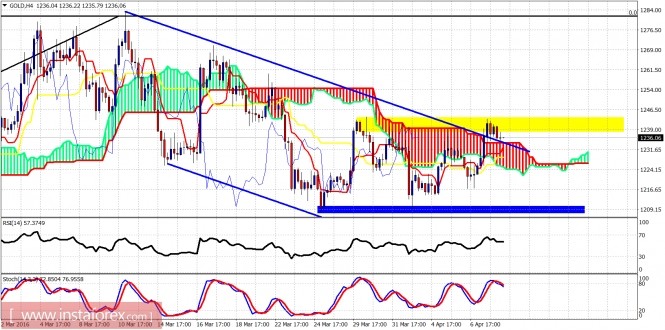
Blue lines - bearish channel
Yellow area - resistance
Blue area - support
Gold has managed to move above the Kumo on the 4-hour chart and out of the bearish channel. However, horizontal resistance at $1,240 has not been broken. The price is stalling around $1,240 and this is not a good sign. Another rejection here could push the price back inside the bearish channel and maybe towards $1,190. Today is an important day as I expect some volatility in Gold prices.

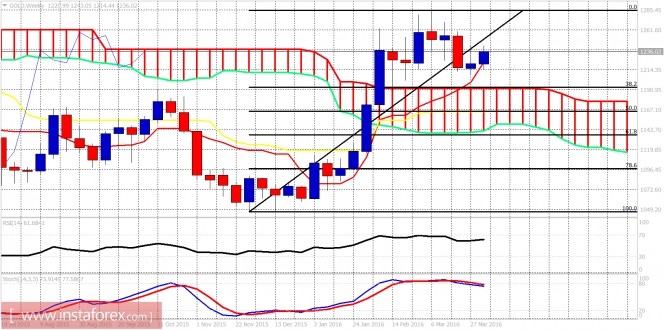
The weekly candle remains supported and above the tenkan-sen (red line indicator). The stochastic is turning lower and this is not a good sign for the bullish trend. However, the price is still above the weekly cloud. I at least expect the price to test the upper boundary of the weekly cloud and the 38% retracement of the rise from $1,045.
The material has been provided by InstaForex Company - www.instaforex.com


