Technical Analysis of NZD/USD for March 25, 2016

Overview:
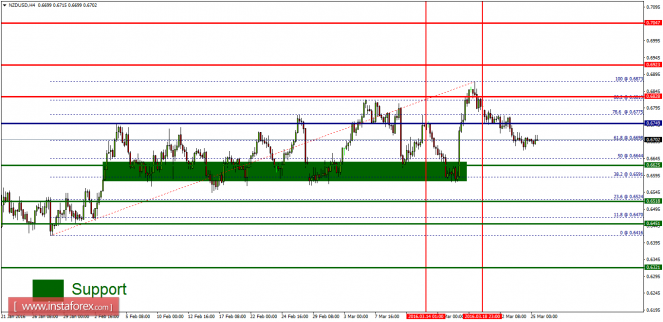
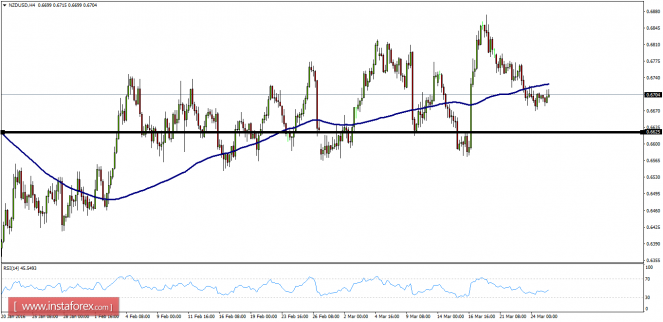
- The NZD/USD pair broke the resistance that turned into strong support at the level of 0.6665. The level of 0.6665 is expected to act as major support today. From this point, we expect the NZD/USD pair to continue moving in a bullish trend from the support levels of 0.6665 and 0.6650. Currently, the price is moving in a bullish channel. This is confirmed by the RSI indicator signaling that we are still in the bullish market. Consequently, the first support is set at the level of 0.6665 (horizontal green line). So, the market is likely to show signs of a bullish trend around the spot of 0.6665 - 0.6650. In other words, buy orders are recommended above the spot of 0.6665 or 0.6650 with the first target at the level of 0.6750, and continue towards 0.6826 (the weekly resistance 1). This would suggest a bearish market because the moving average (100) is still in a positive area and does not show any trend-reversal signs at the moment.

- On the other hand, if the NZD/USD pair fails to break through the resistance level of 0.6635 in coming hours, the market will decline further to 1.4473. The pair is expected to drop lower towards at least 0.6515 to test the weekly support. It should be also noted that the weekly support will act as the major support today.
The material has been provided by InstaForex Company - www.instaforex.com


